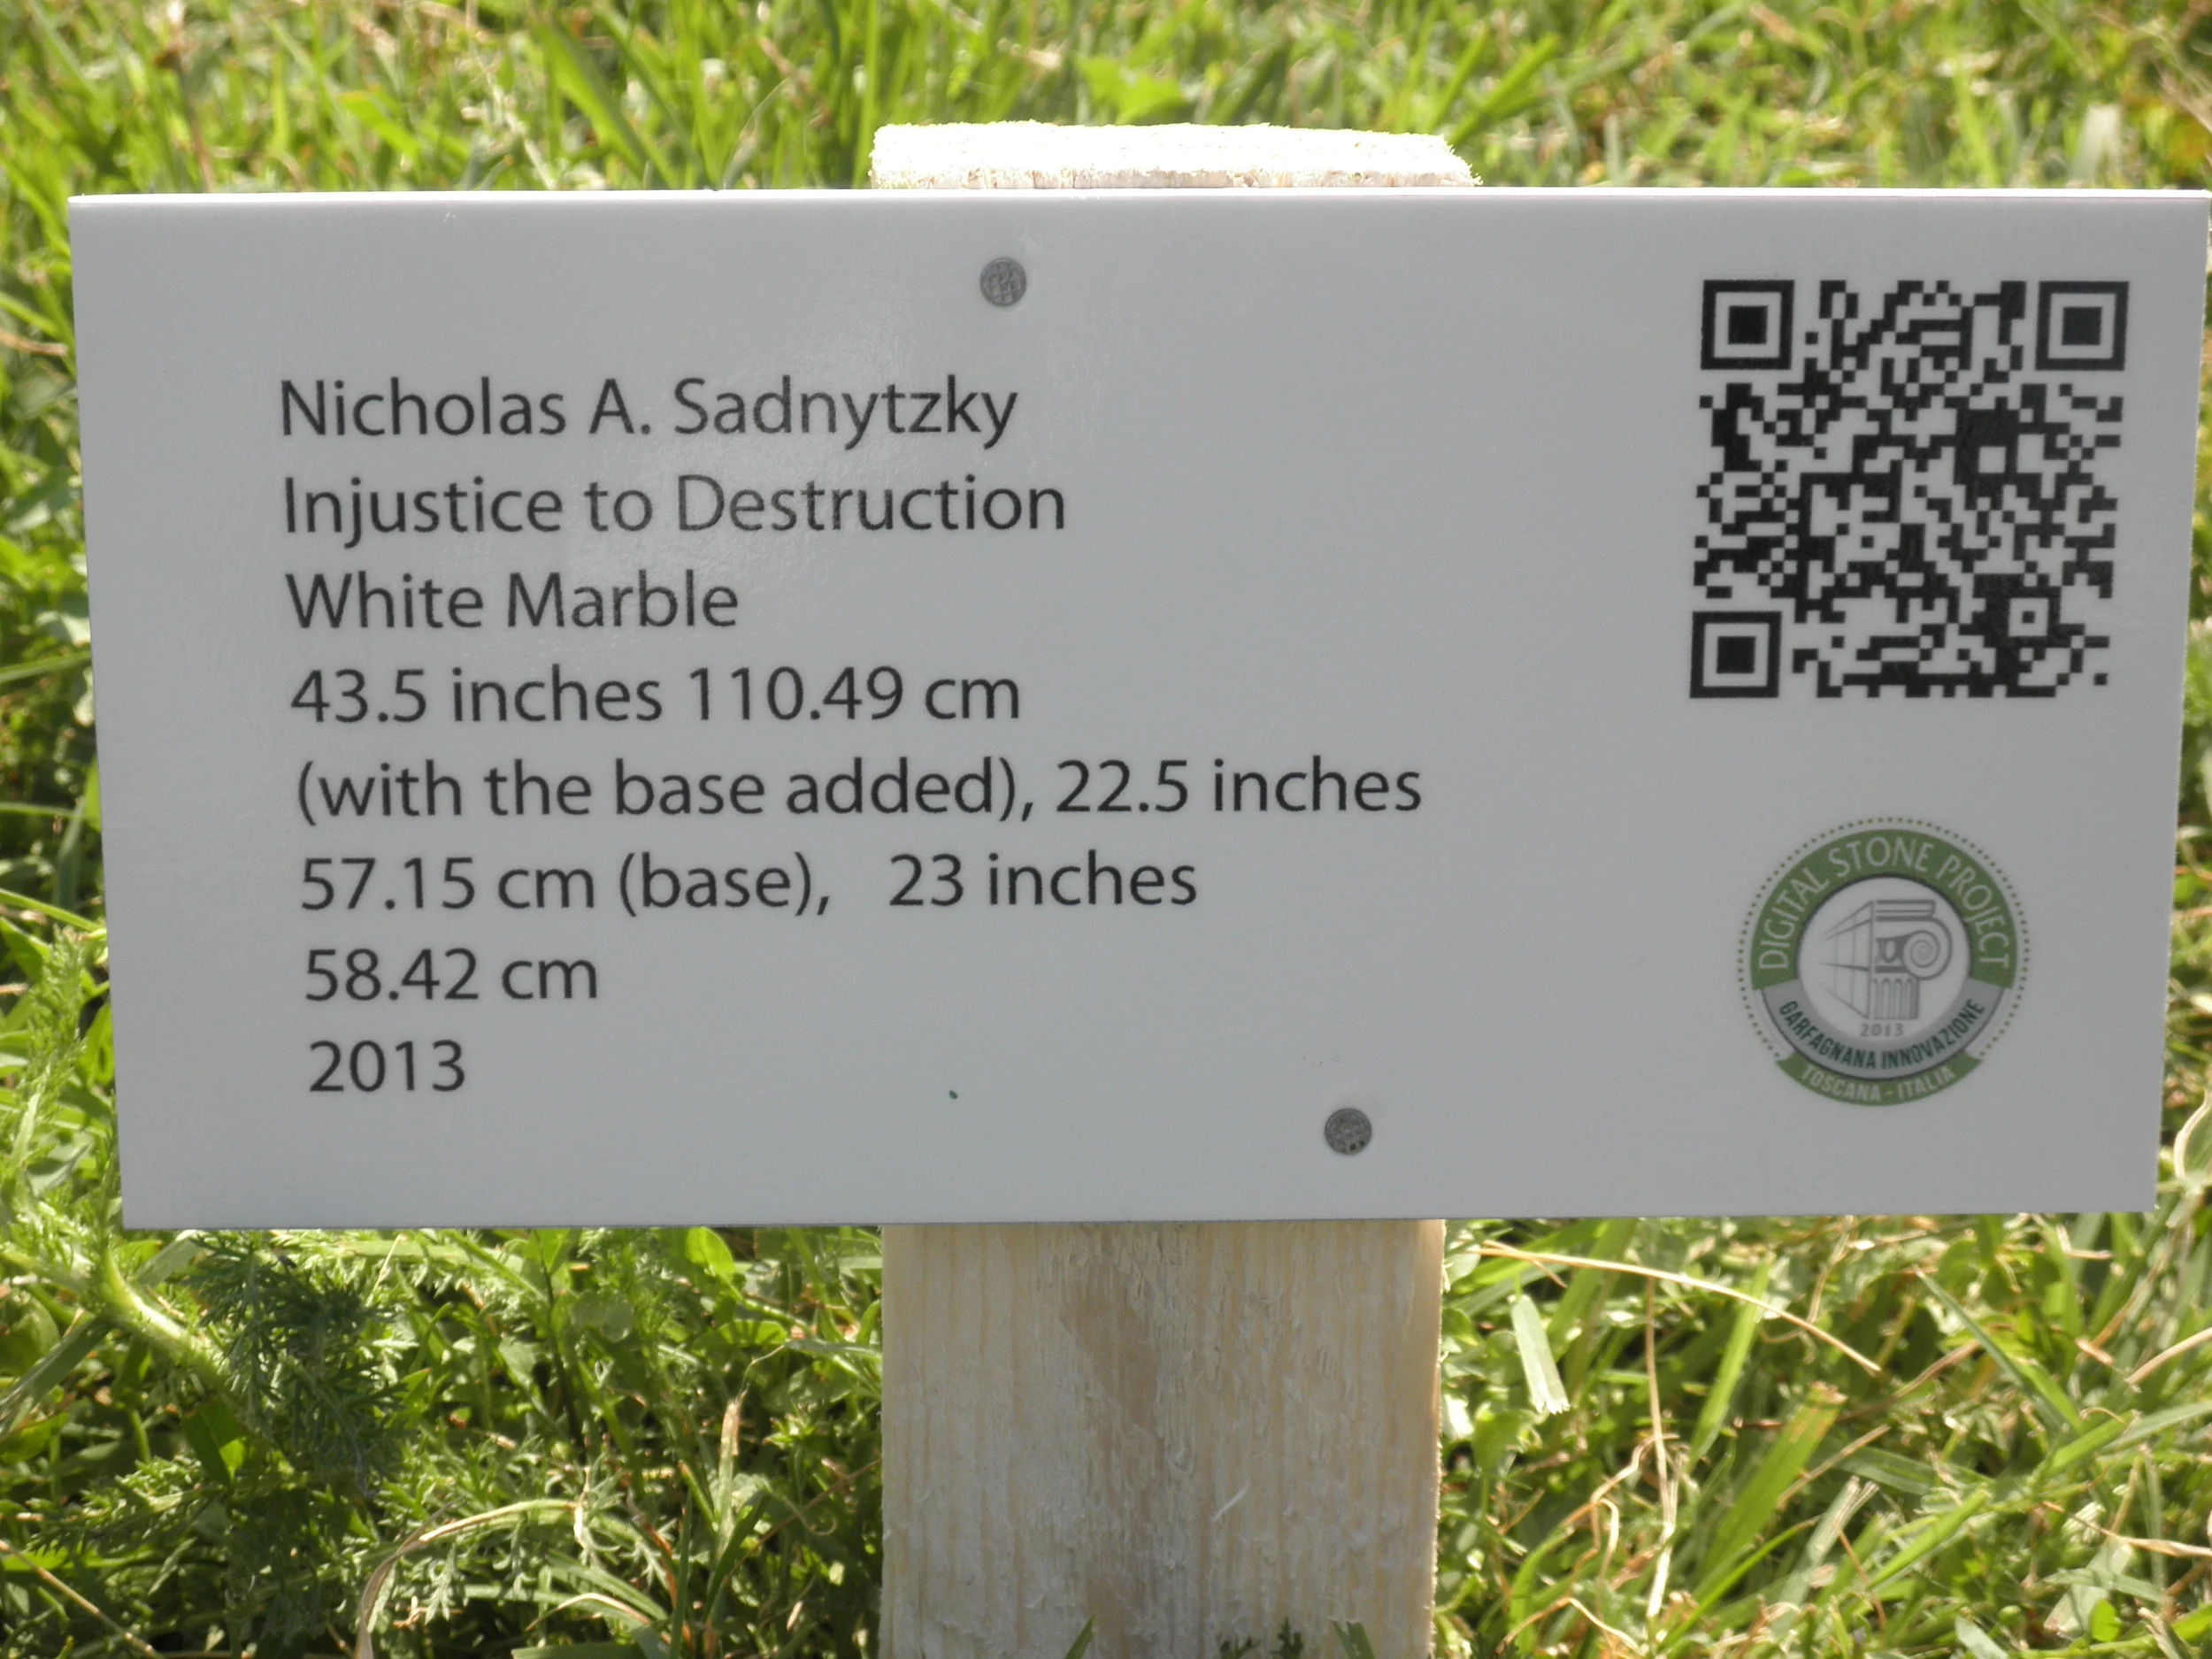
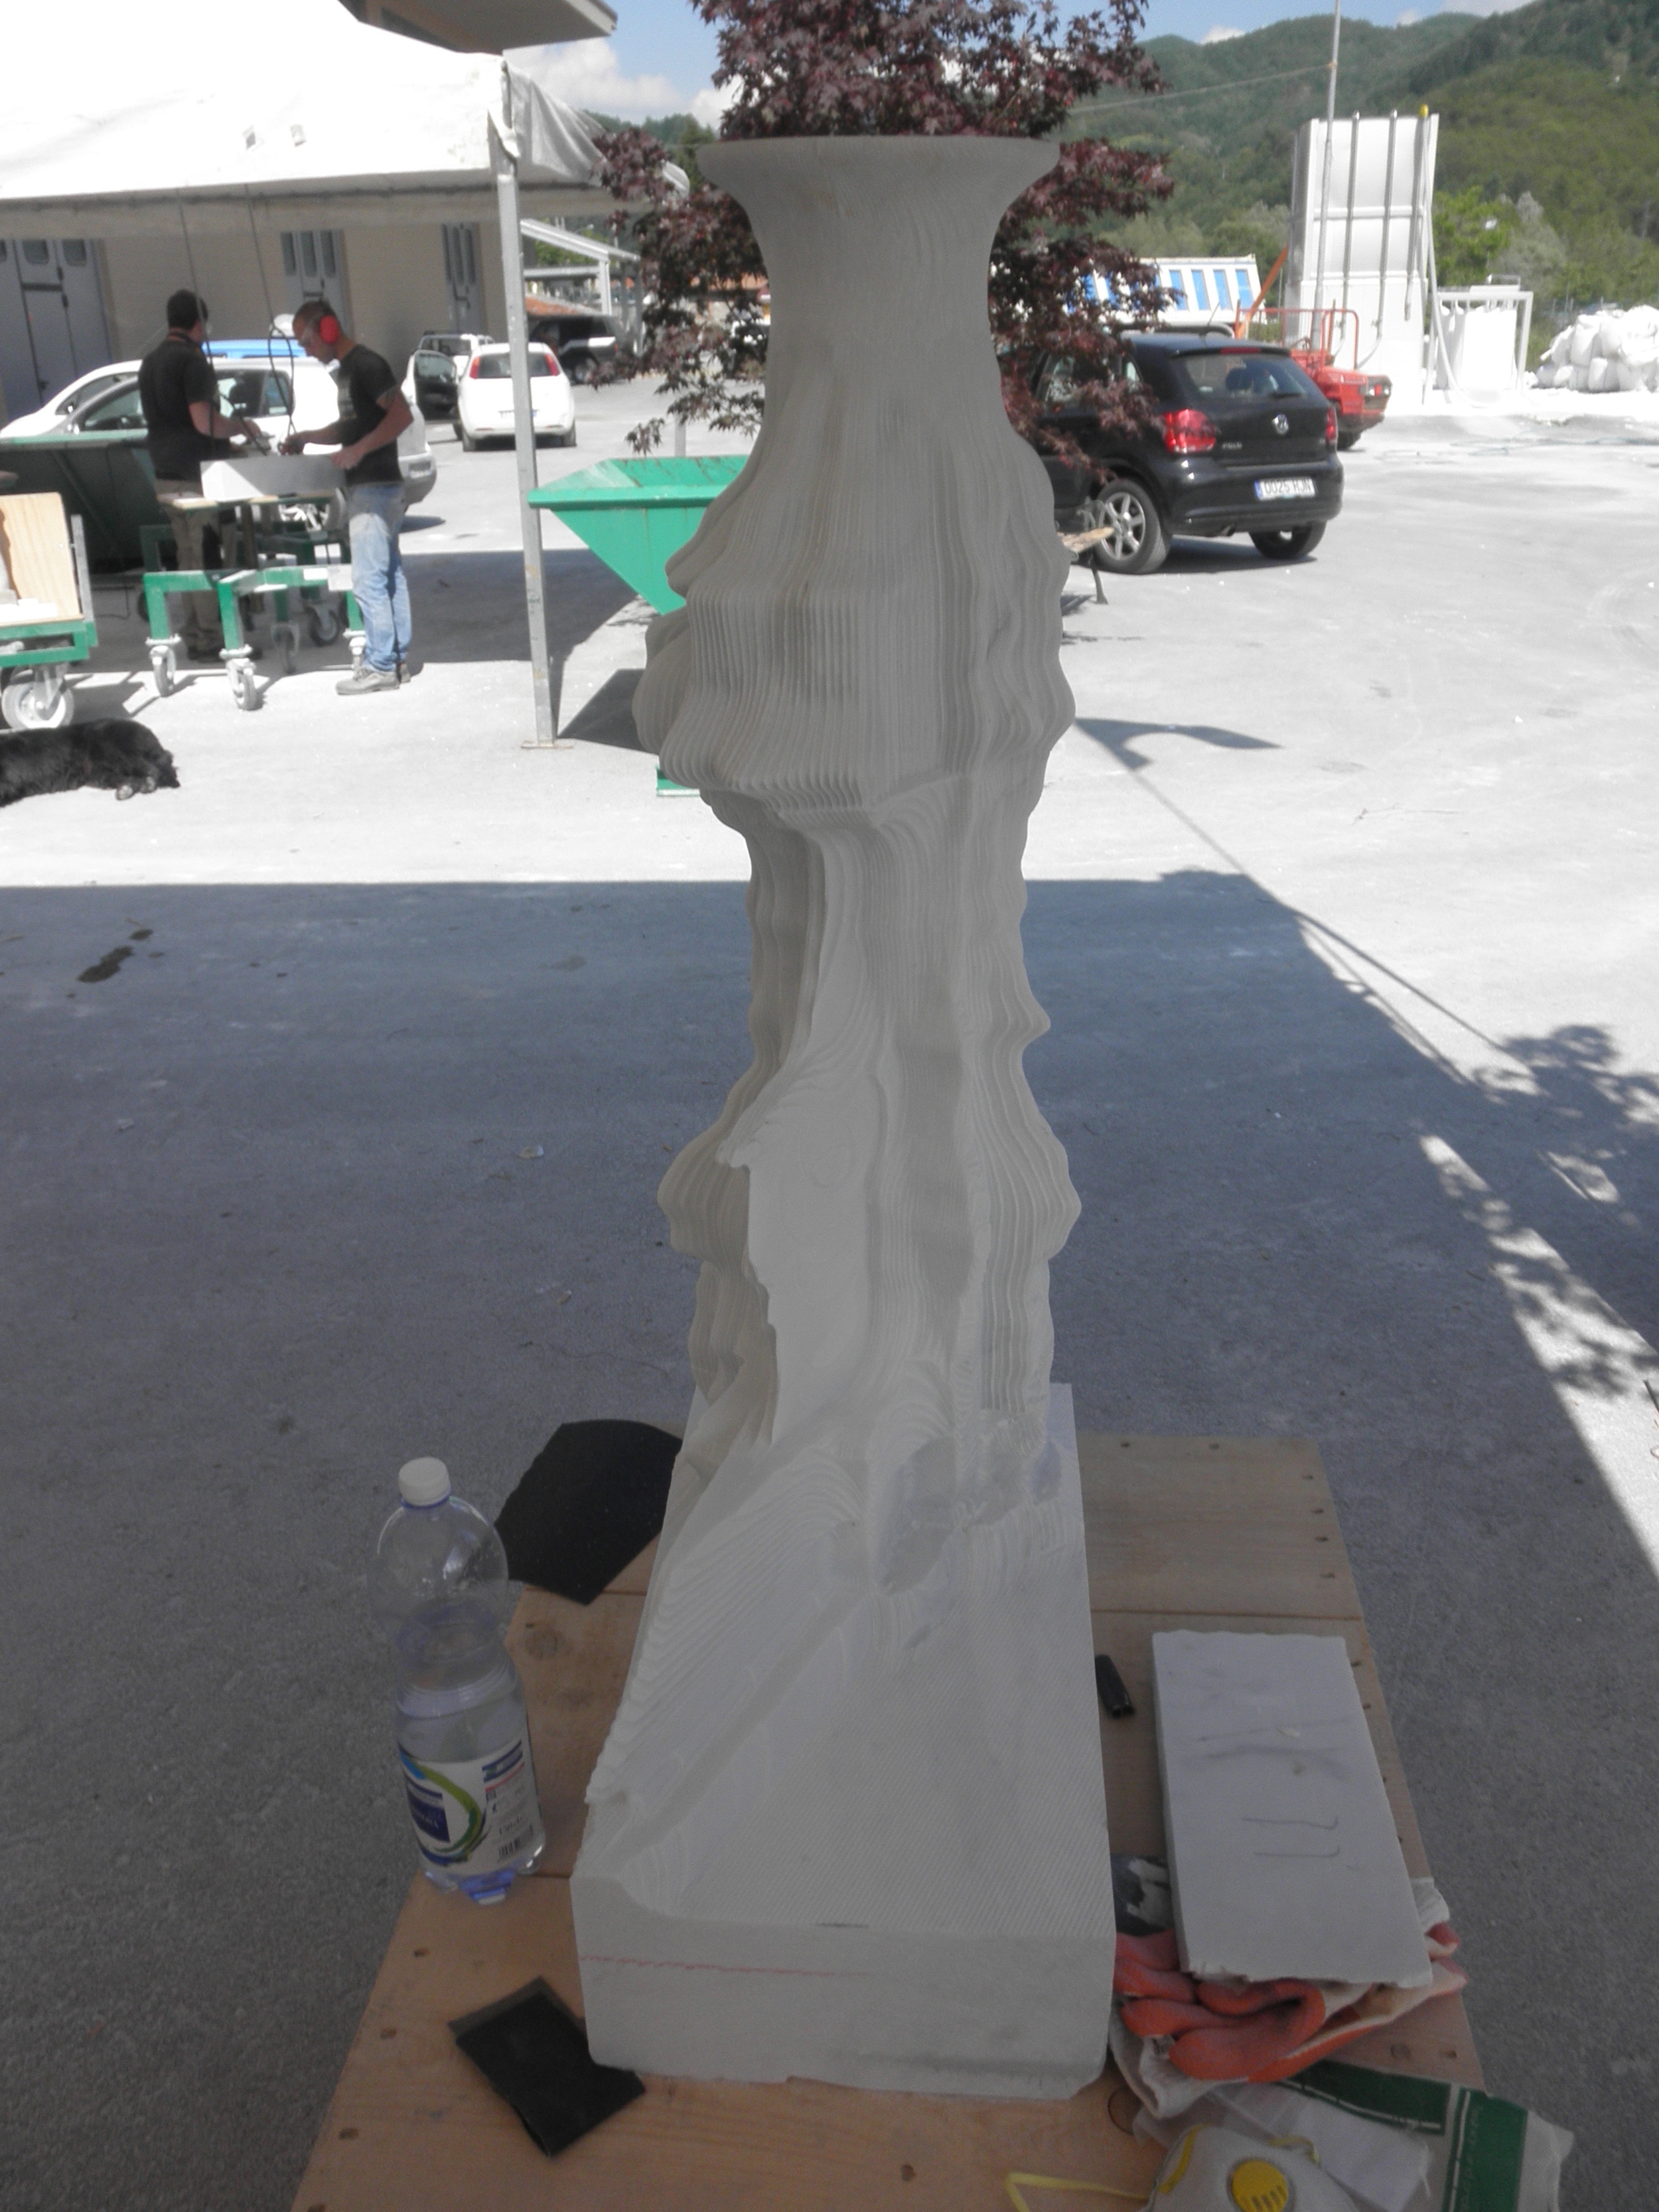
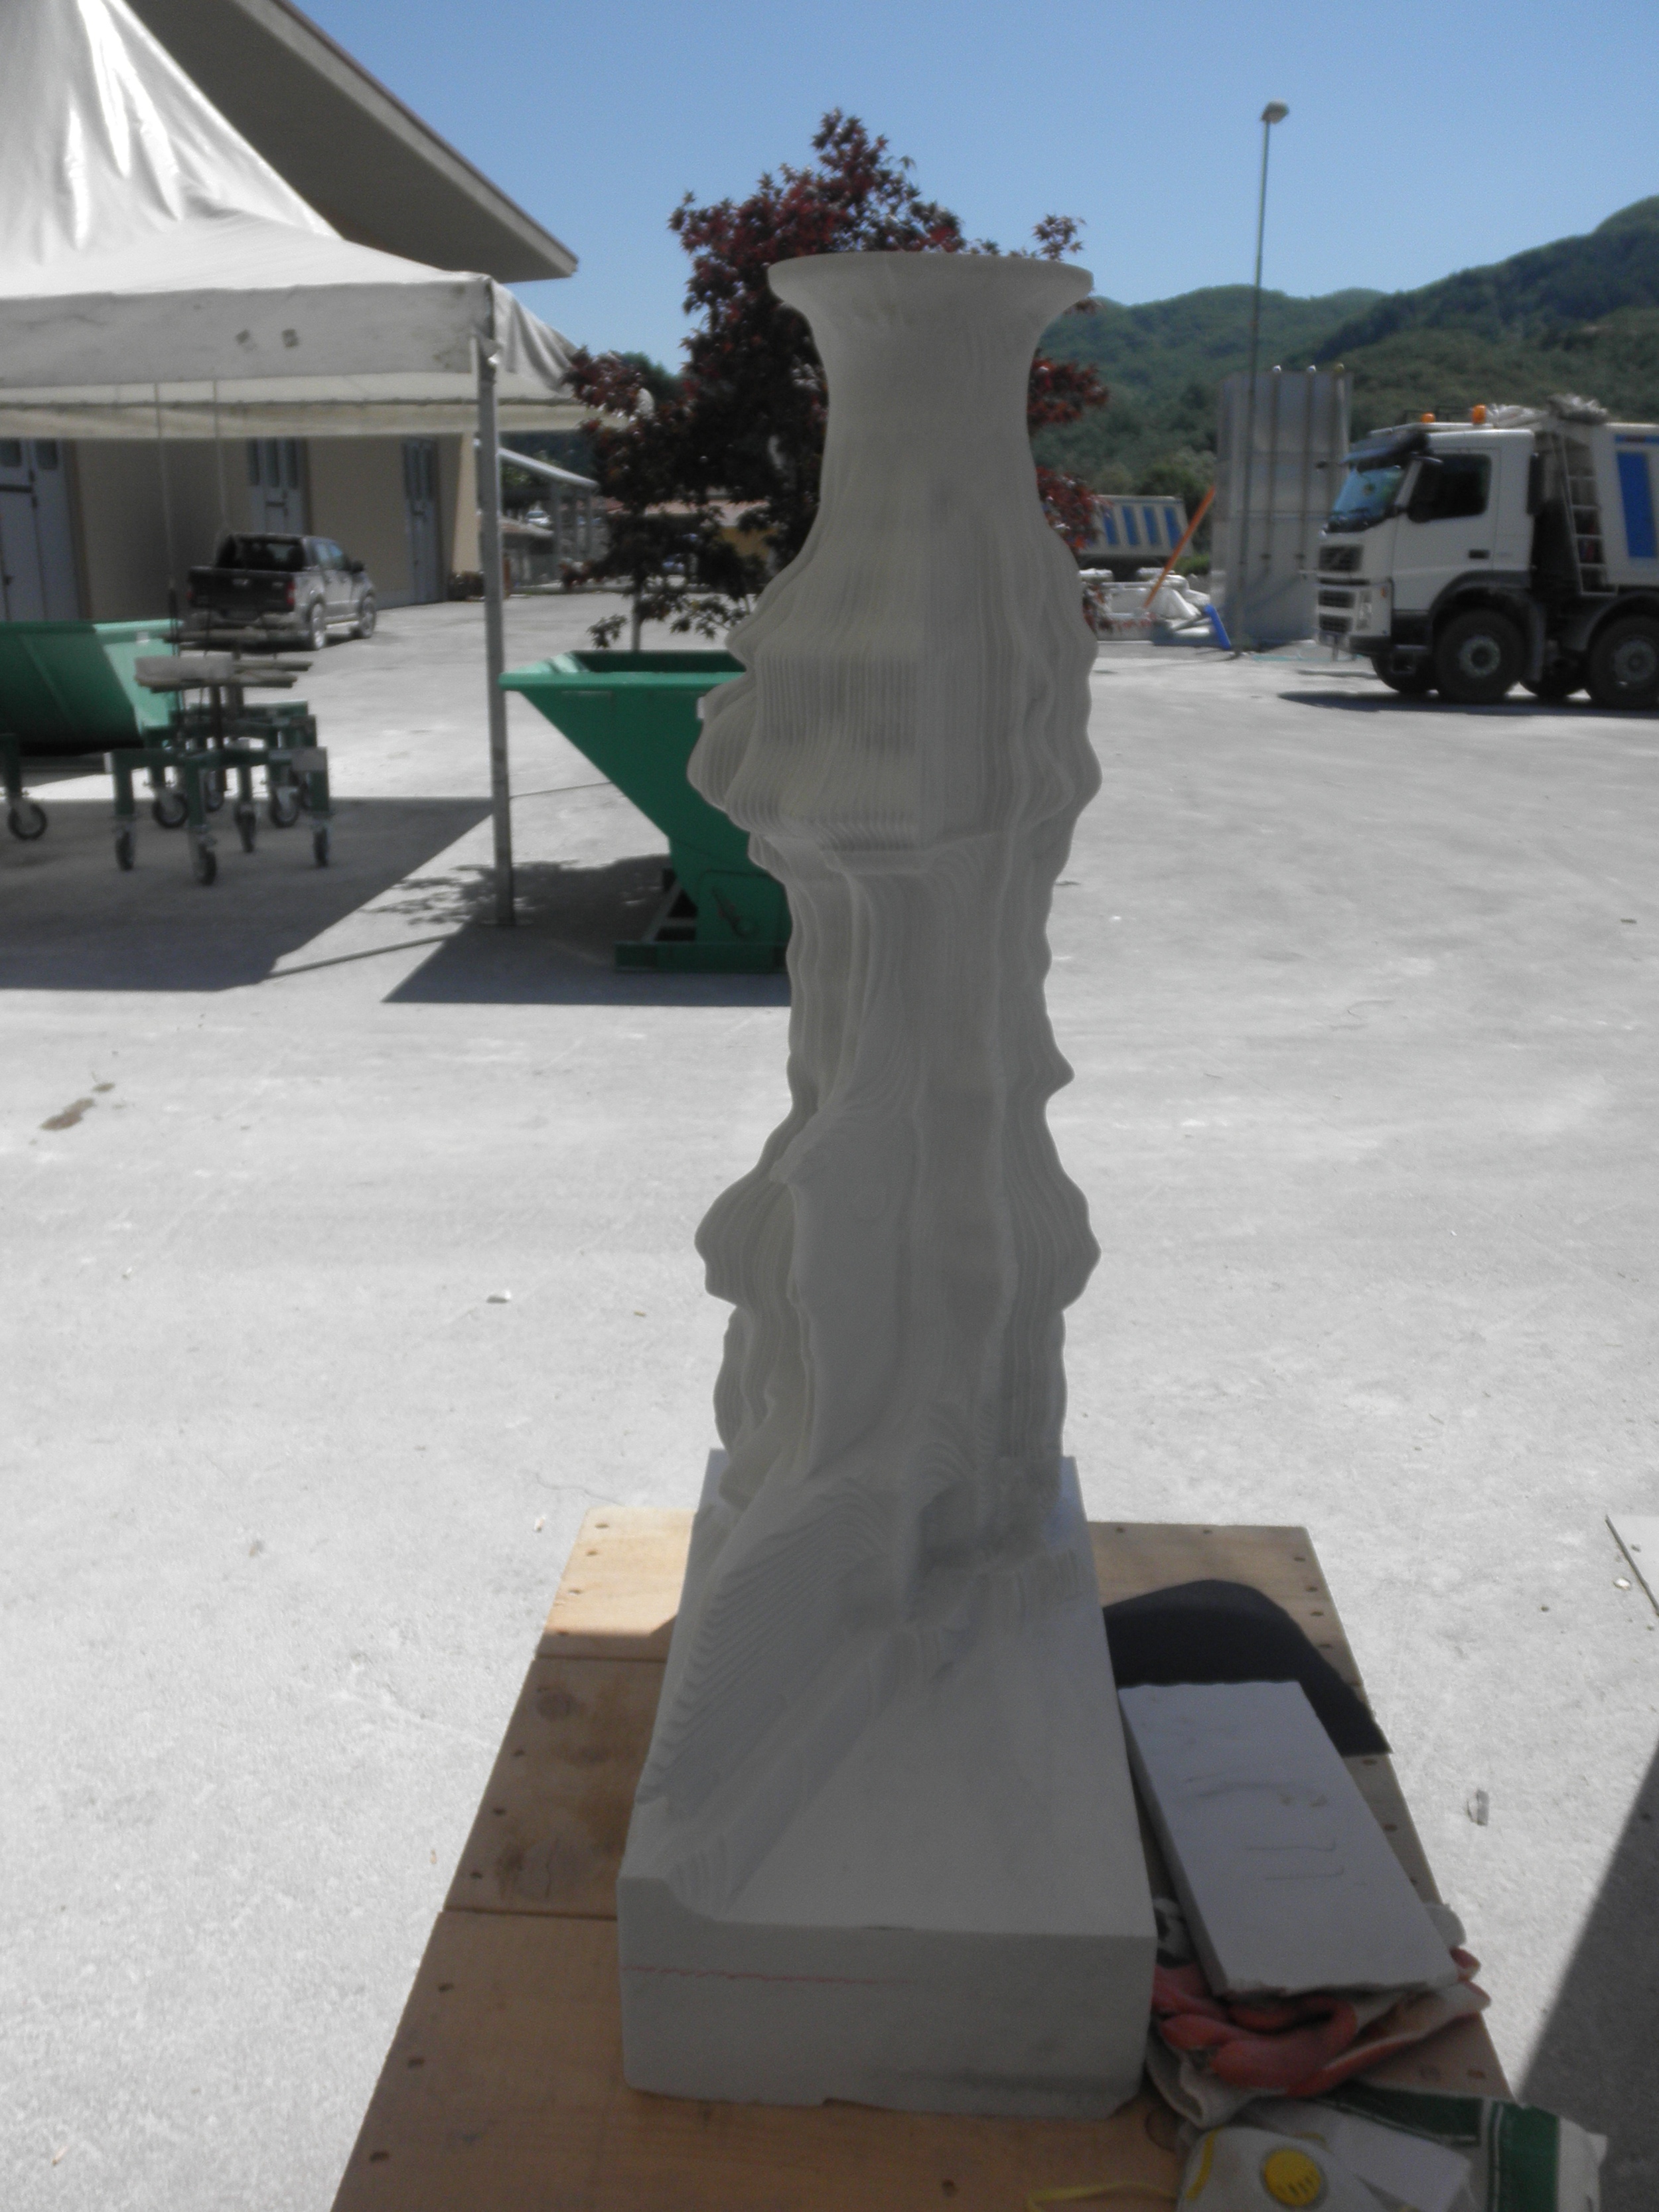
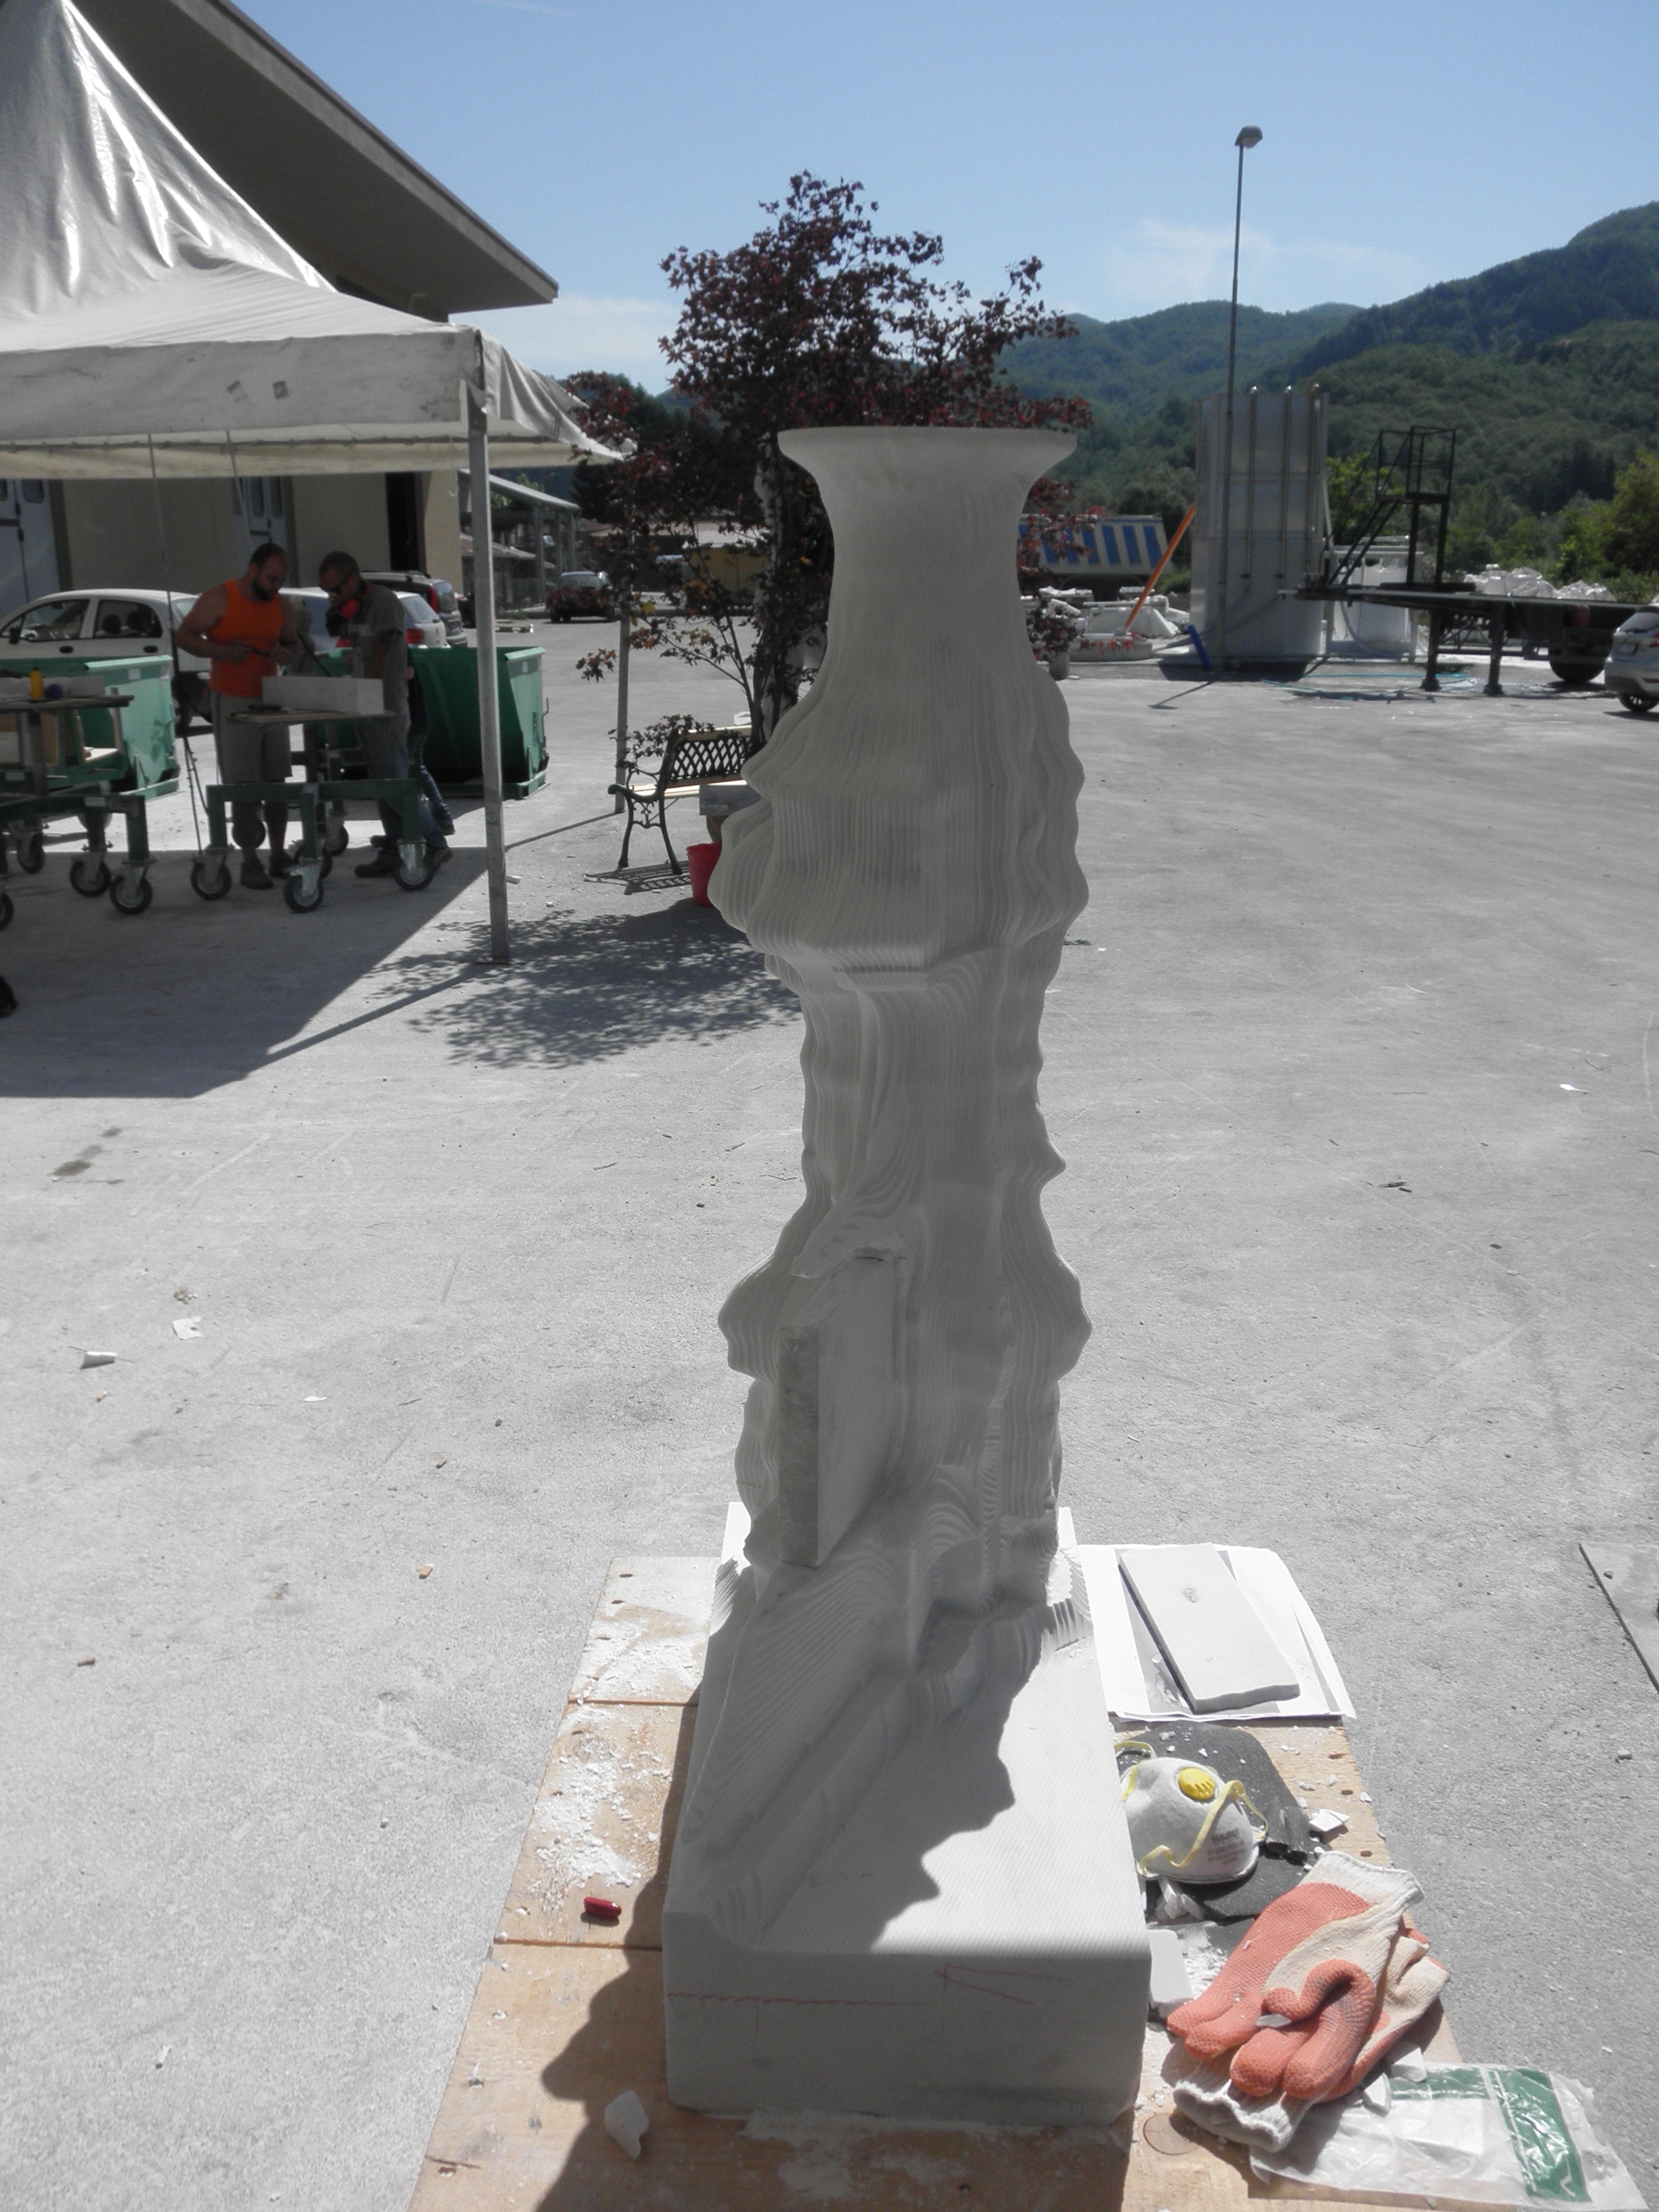
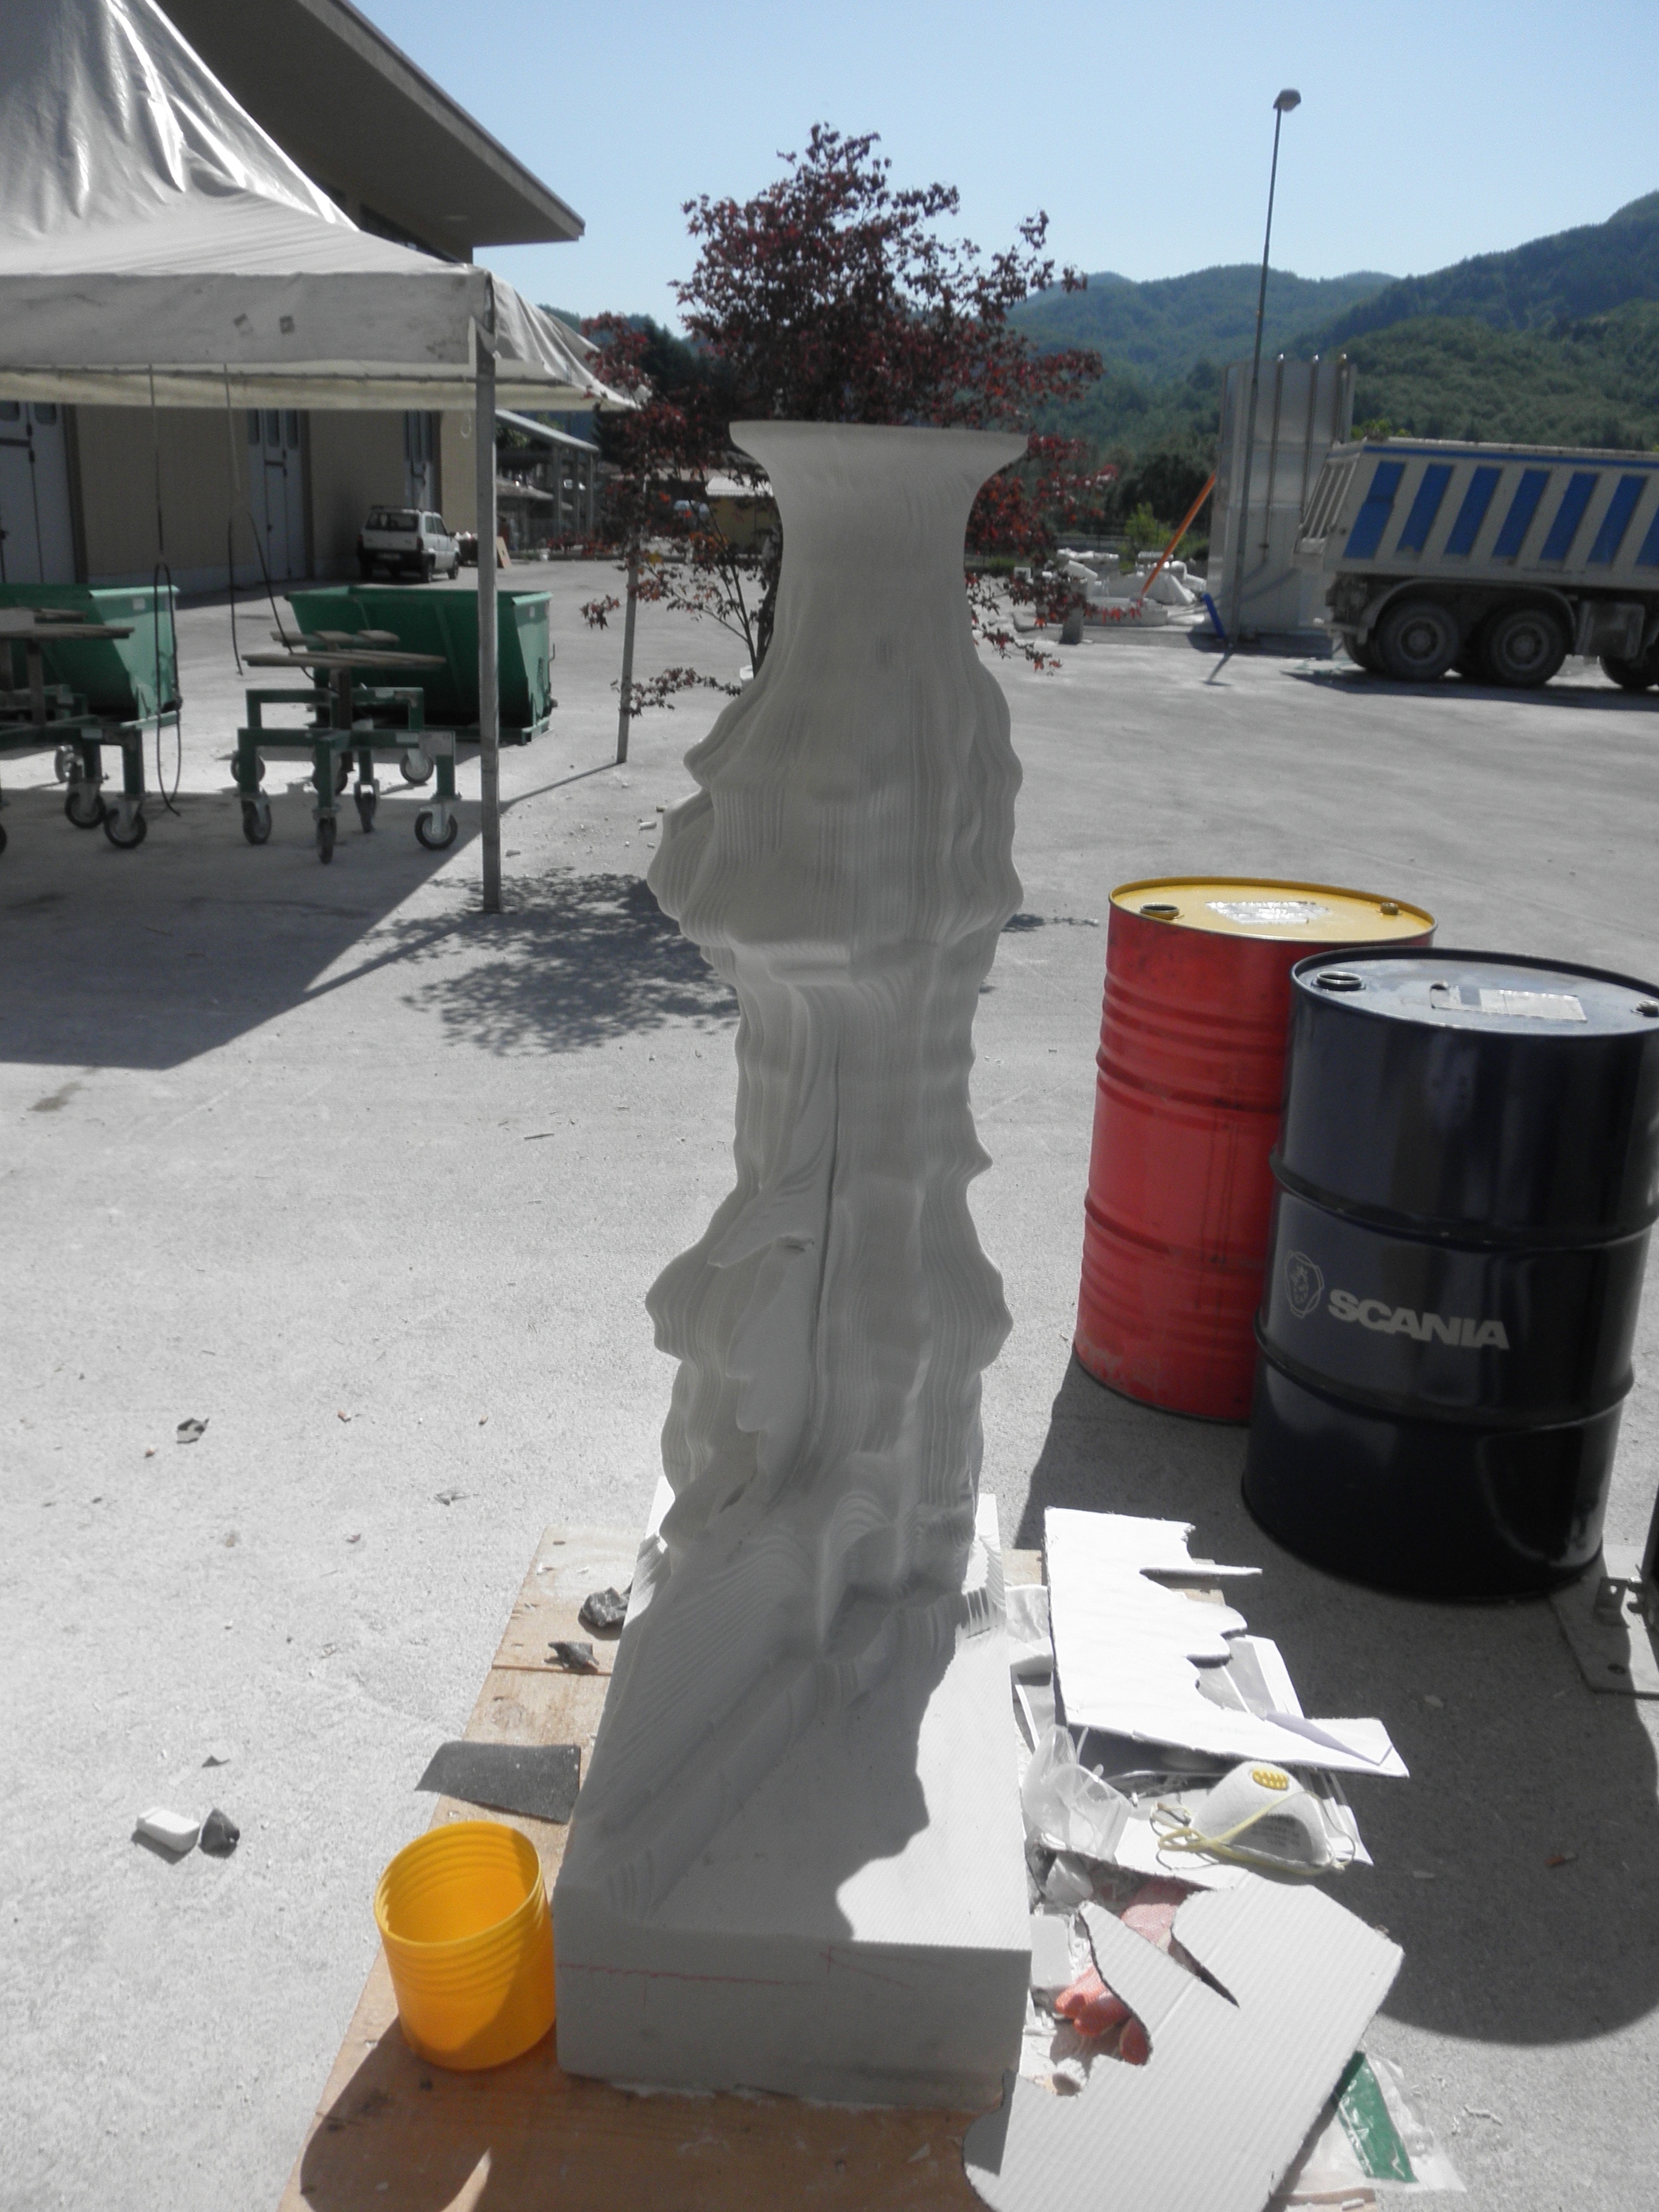
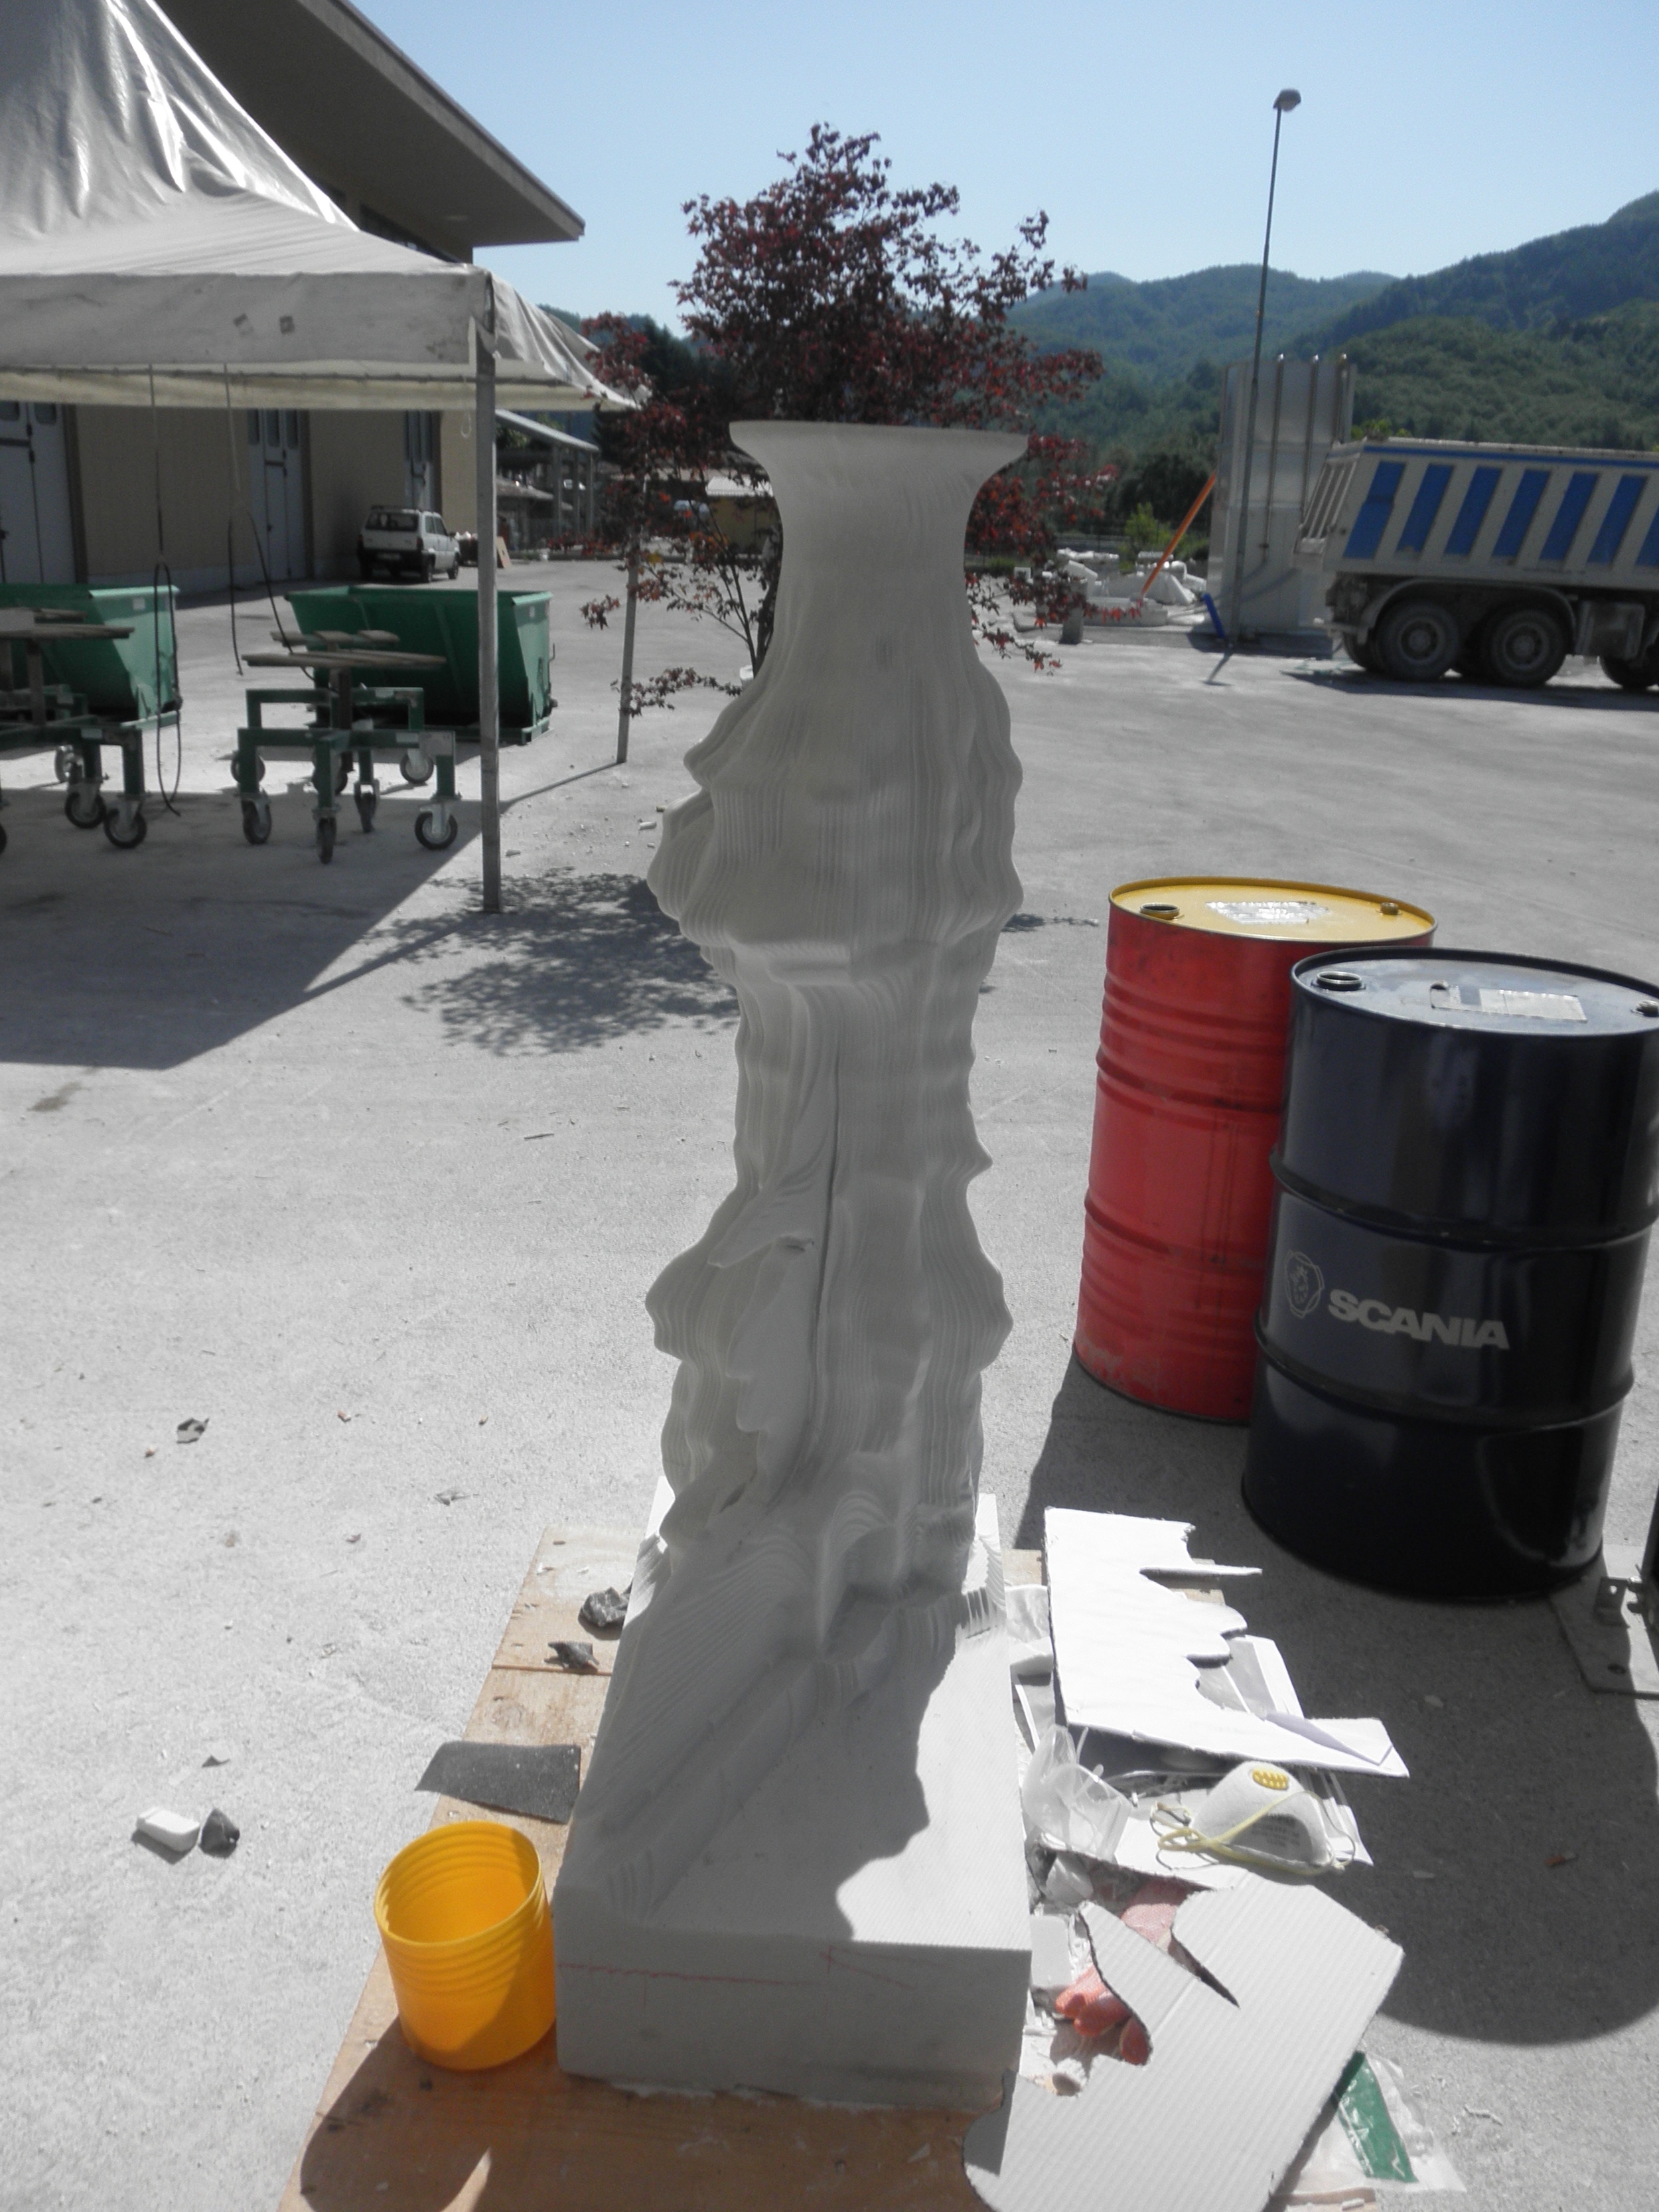
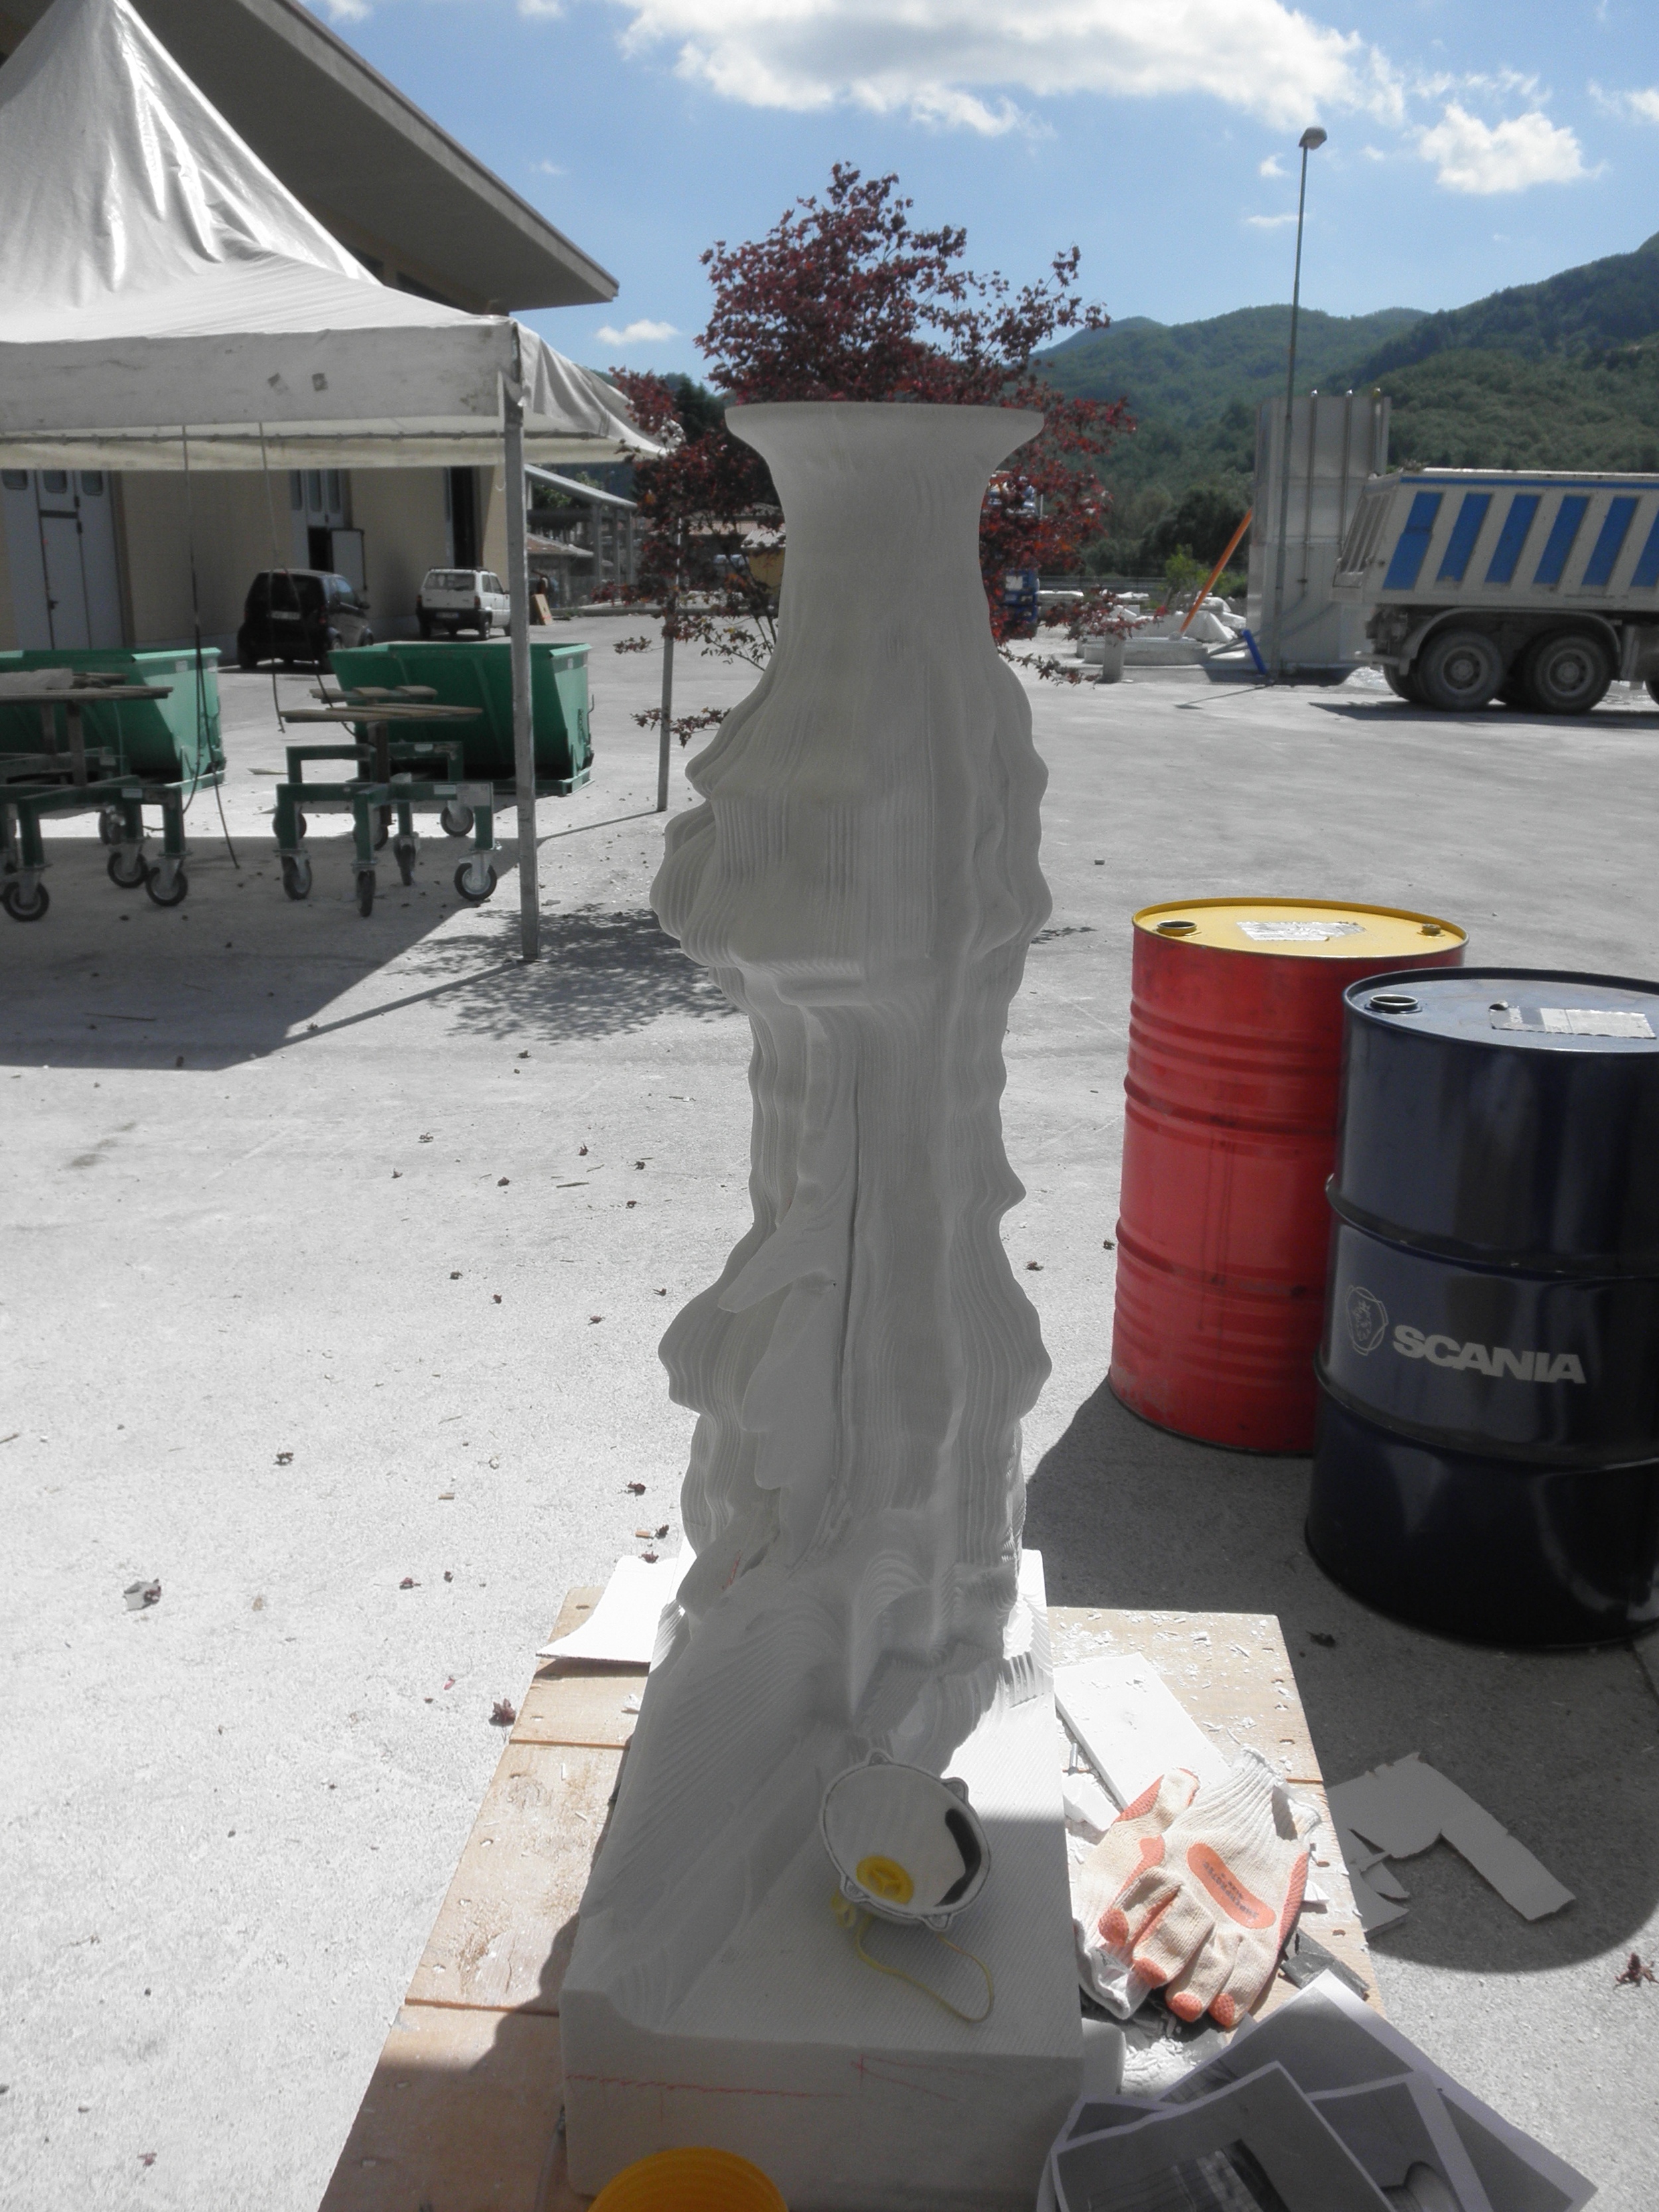
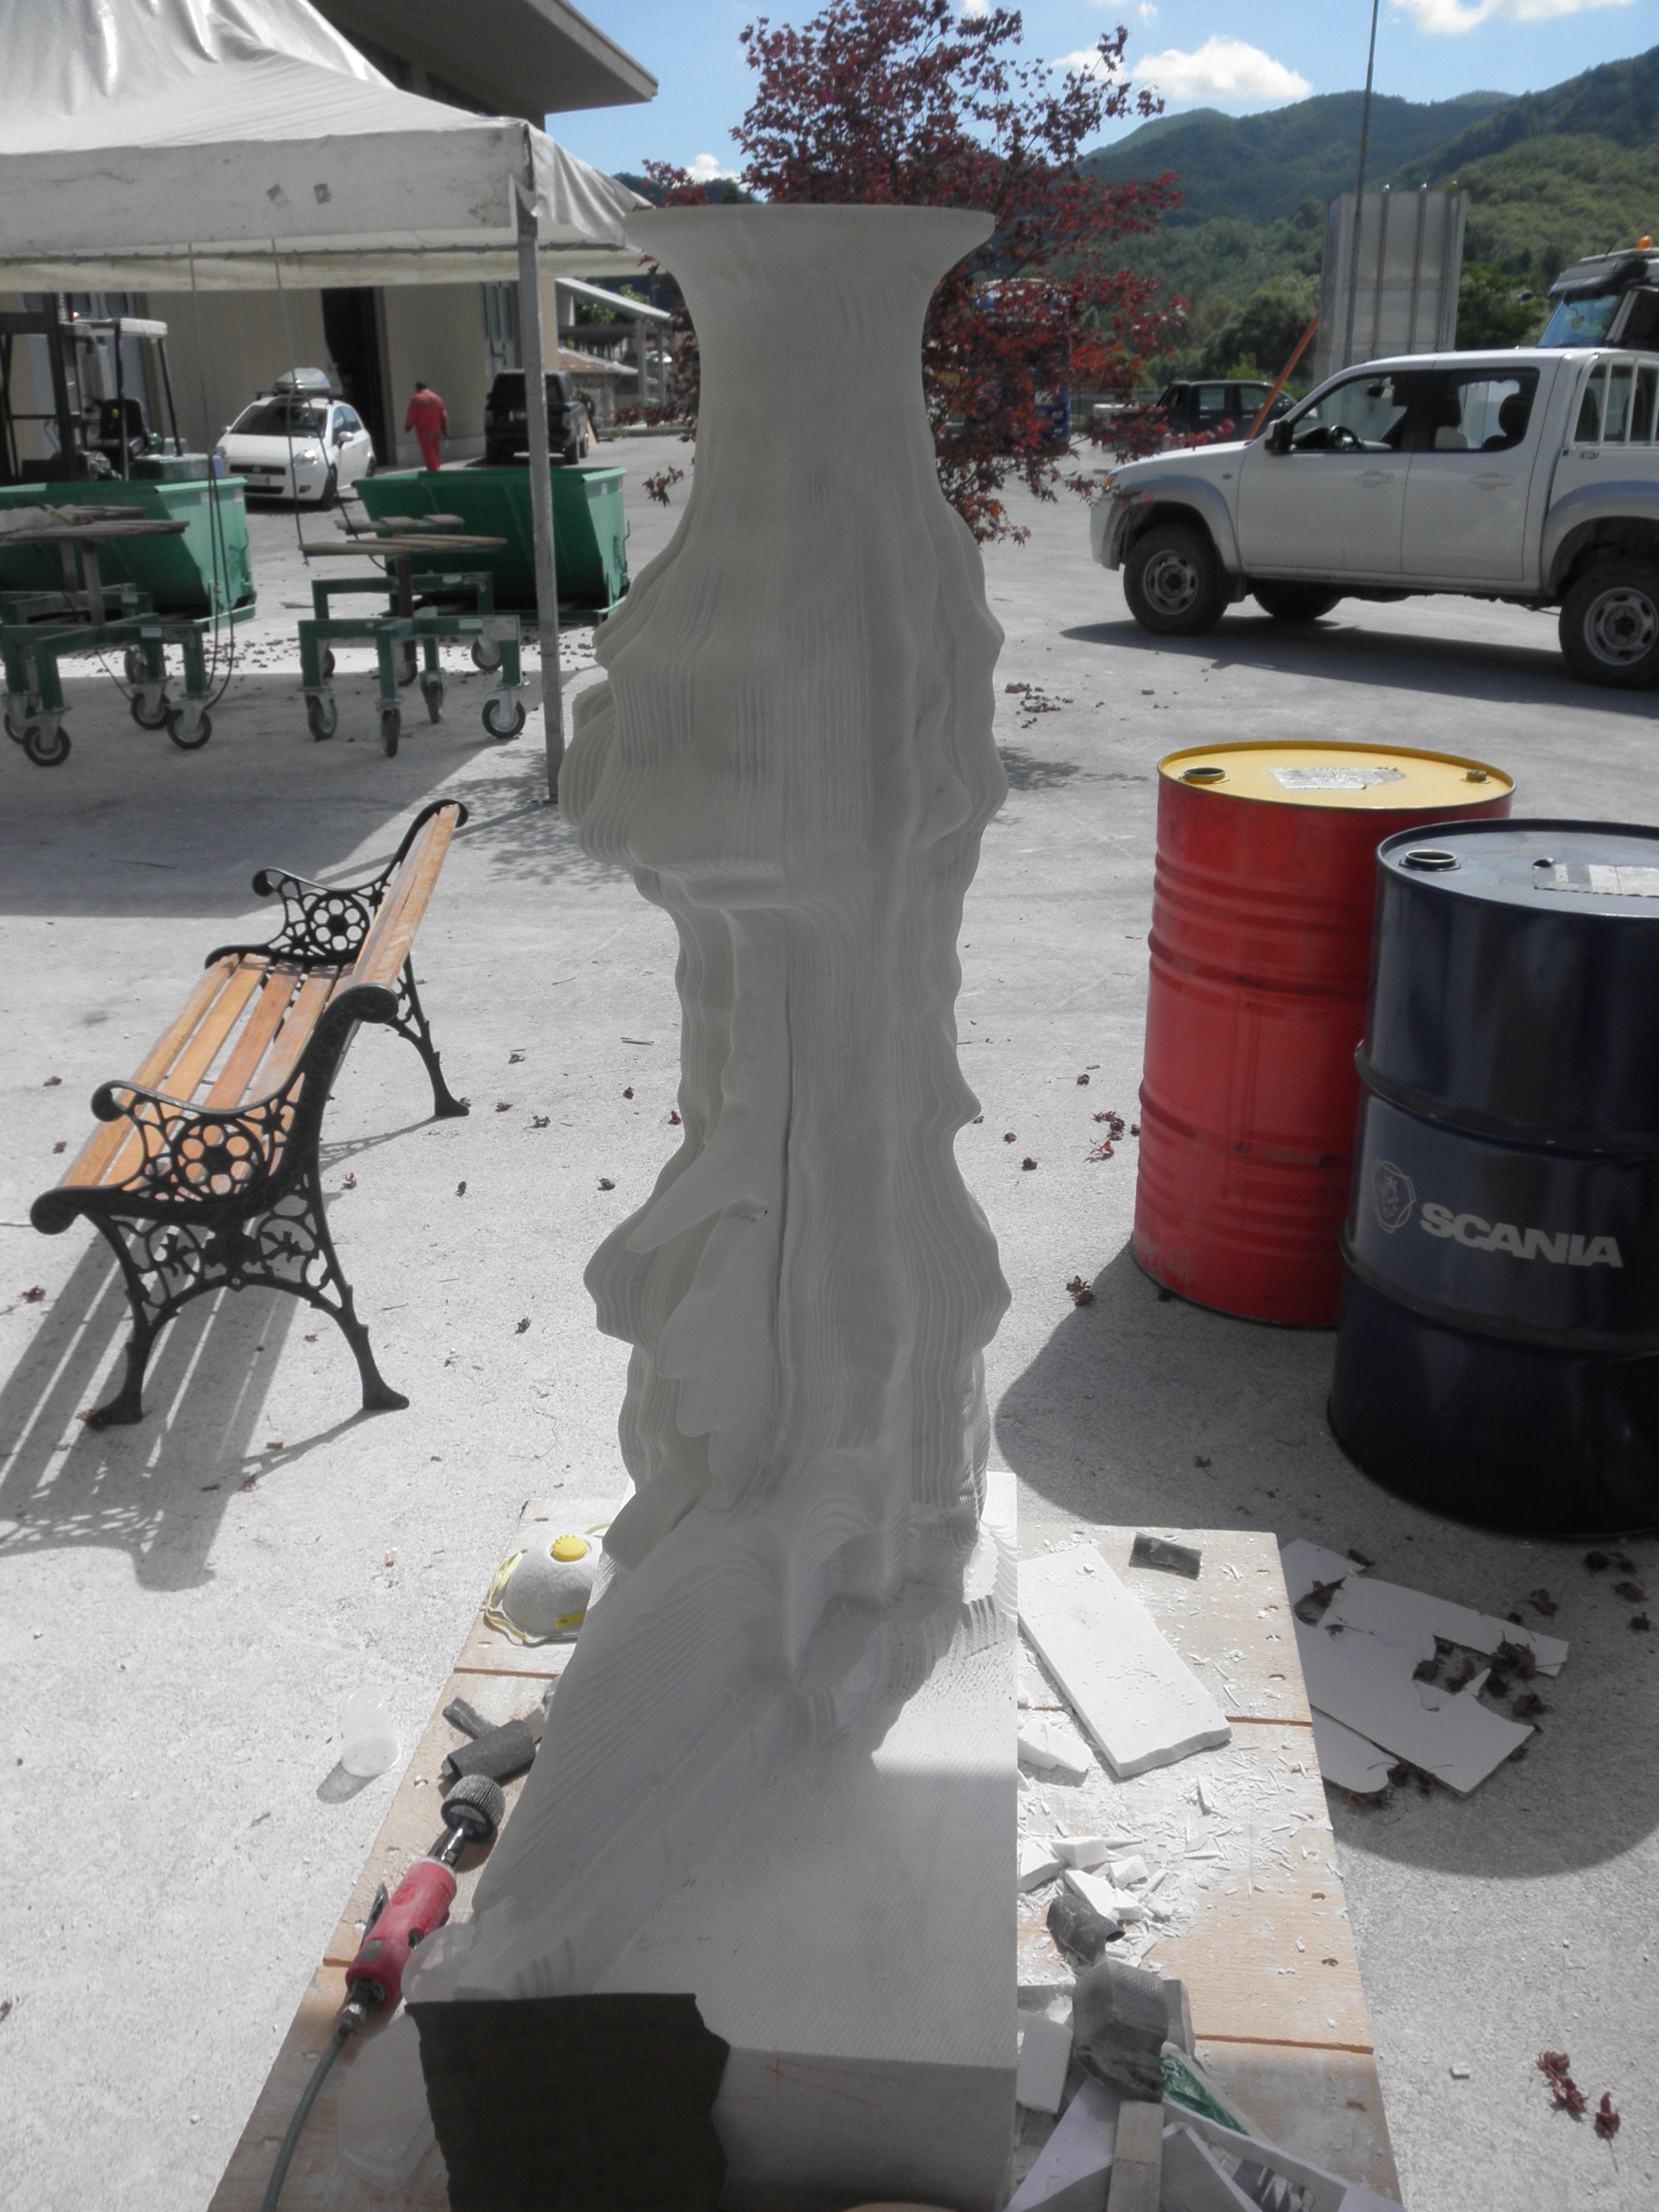
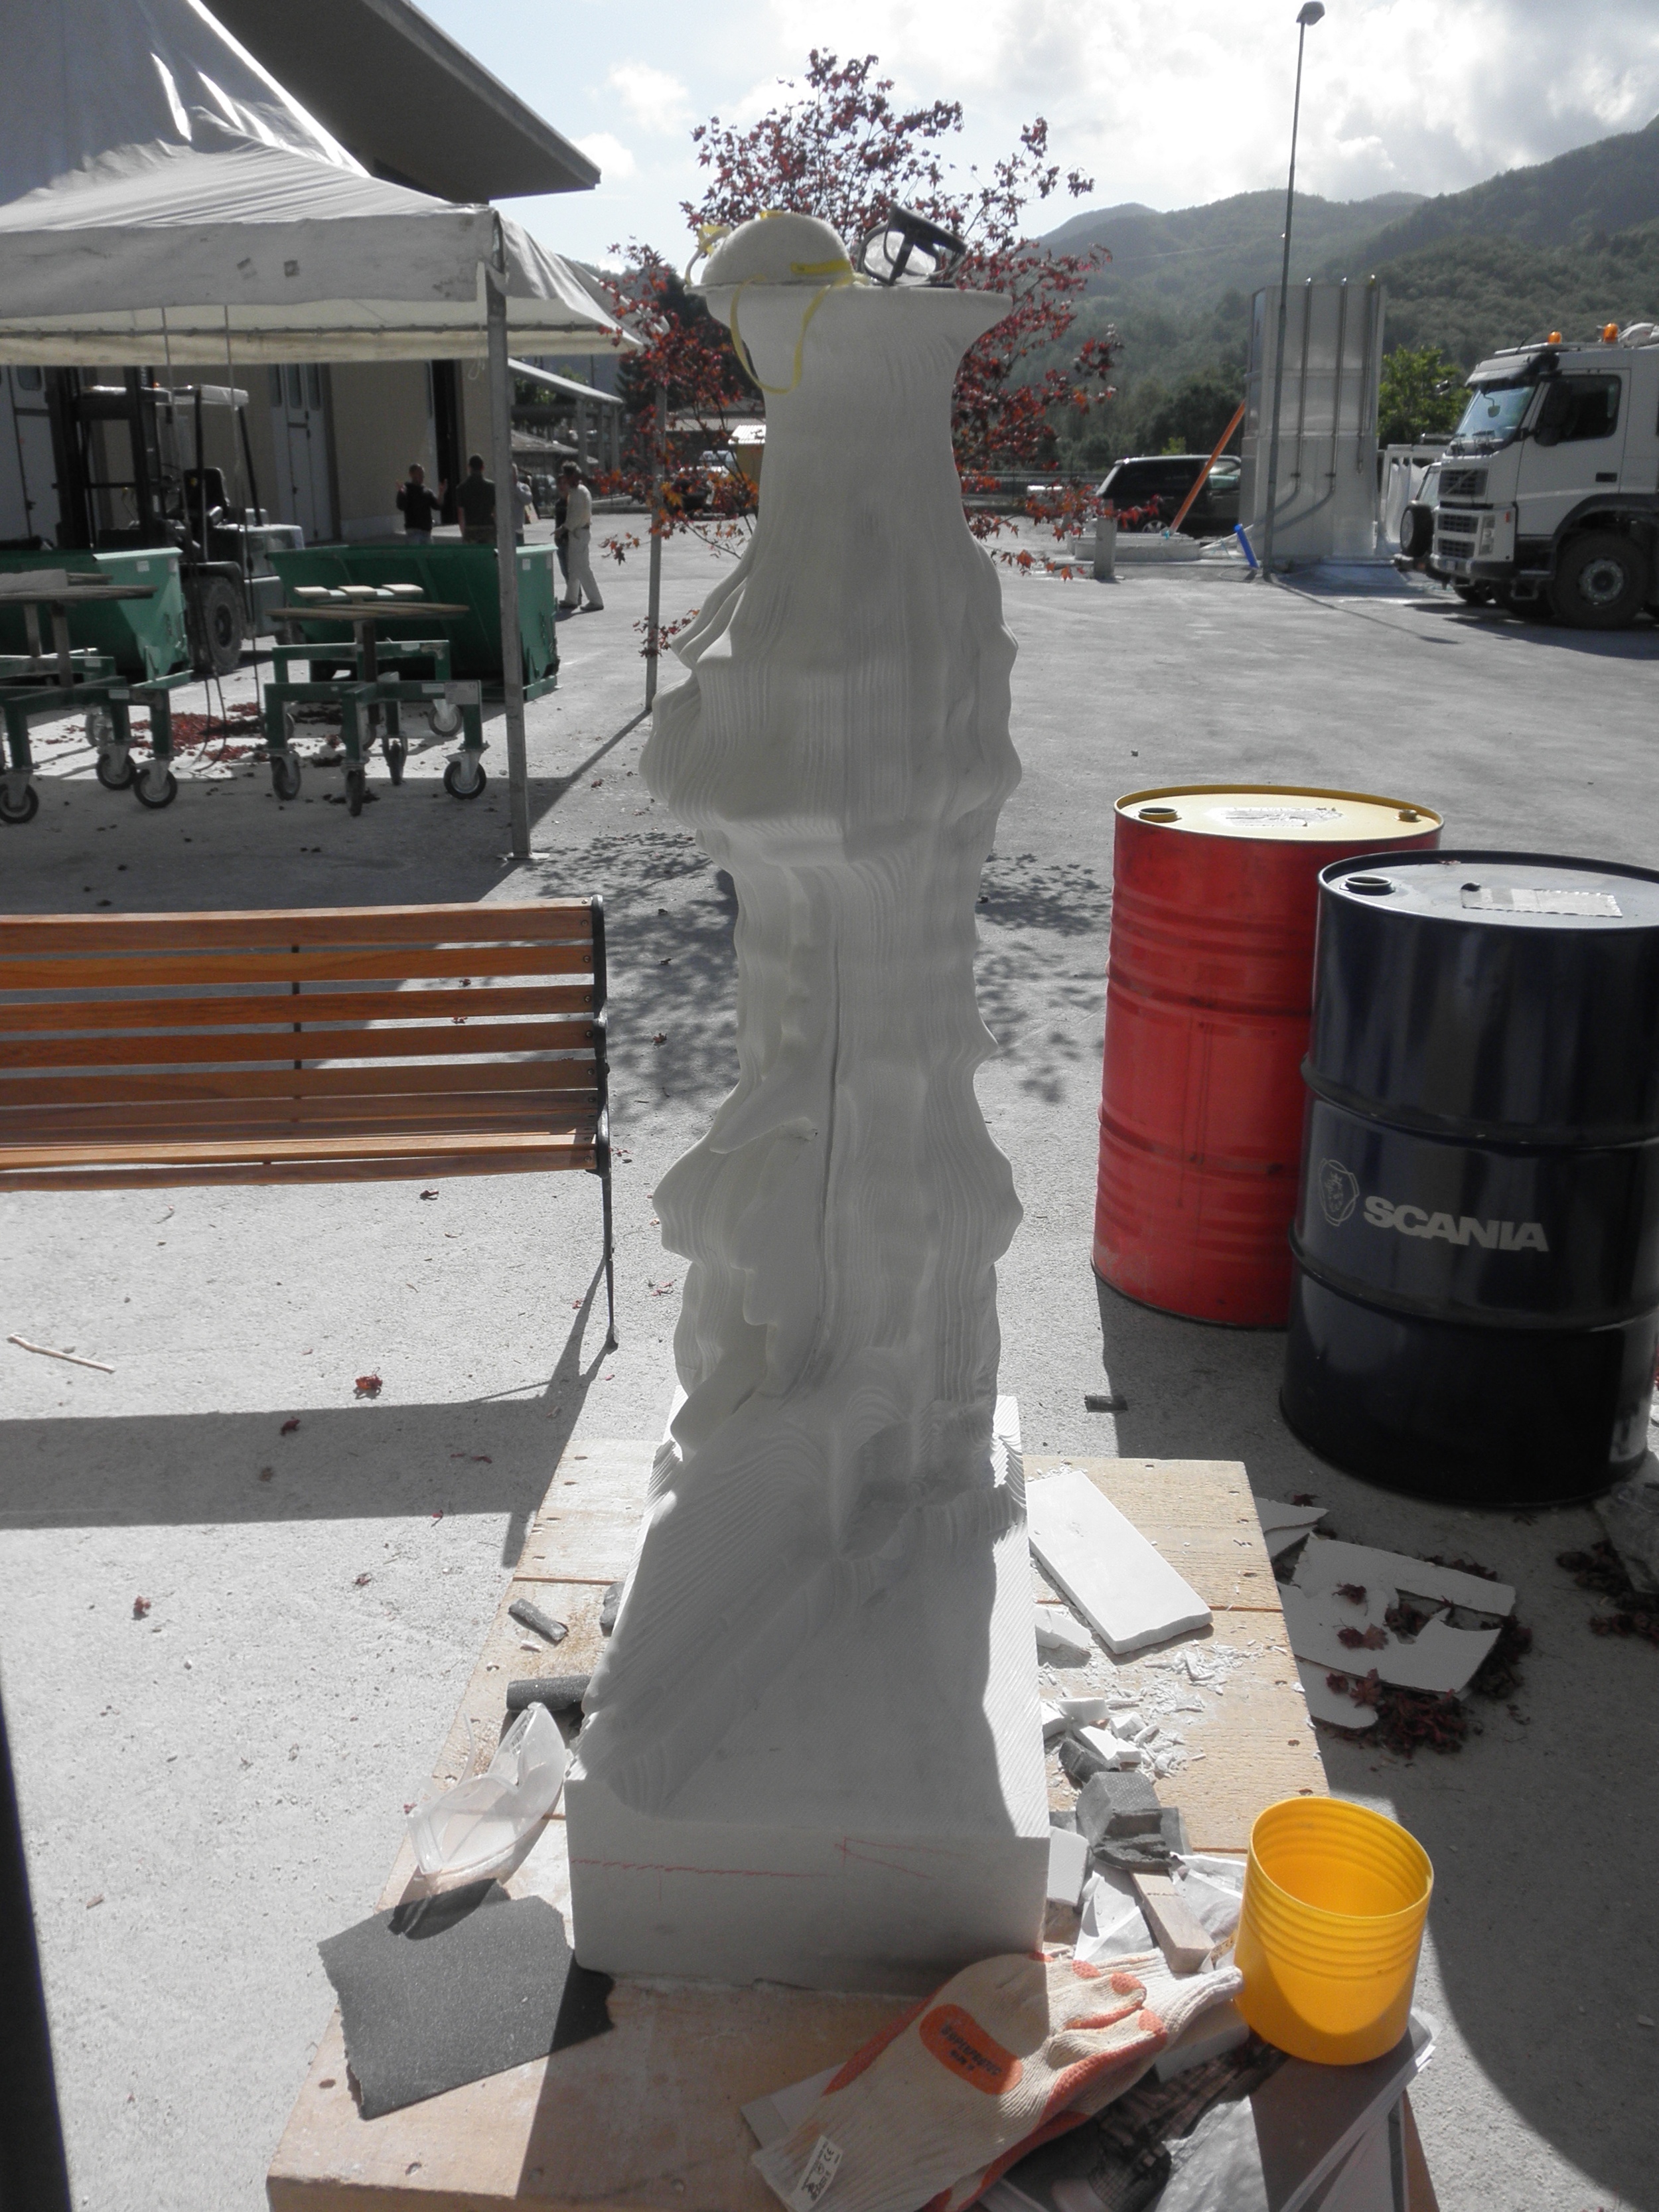
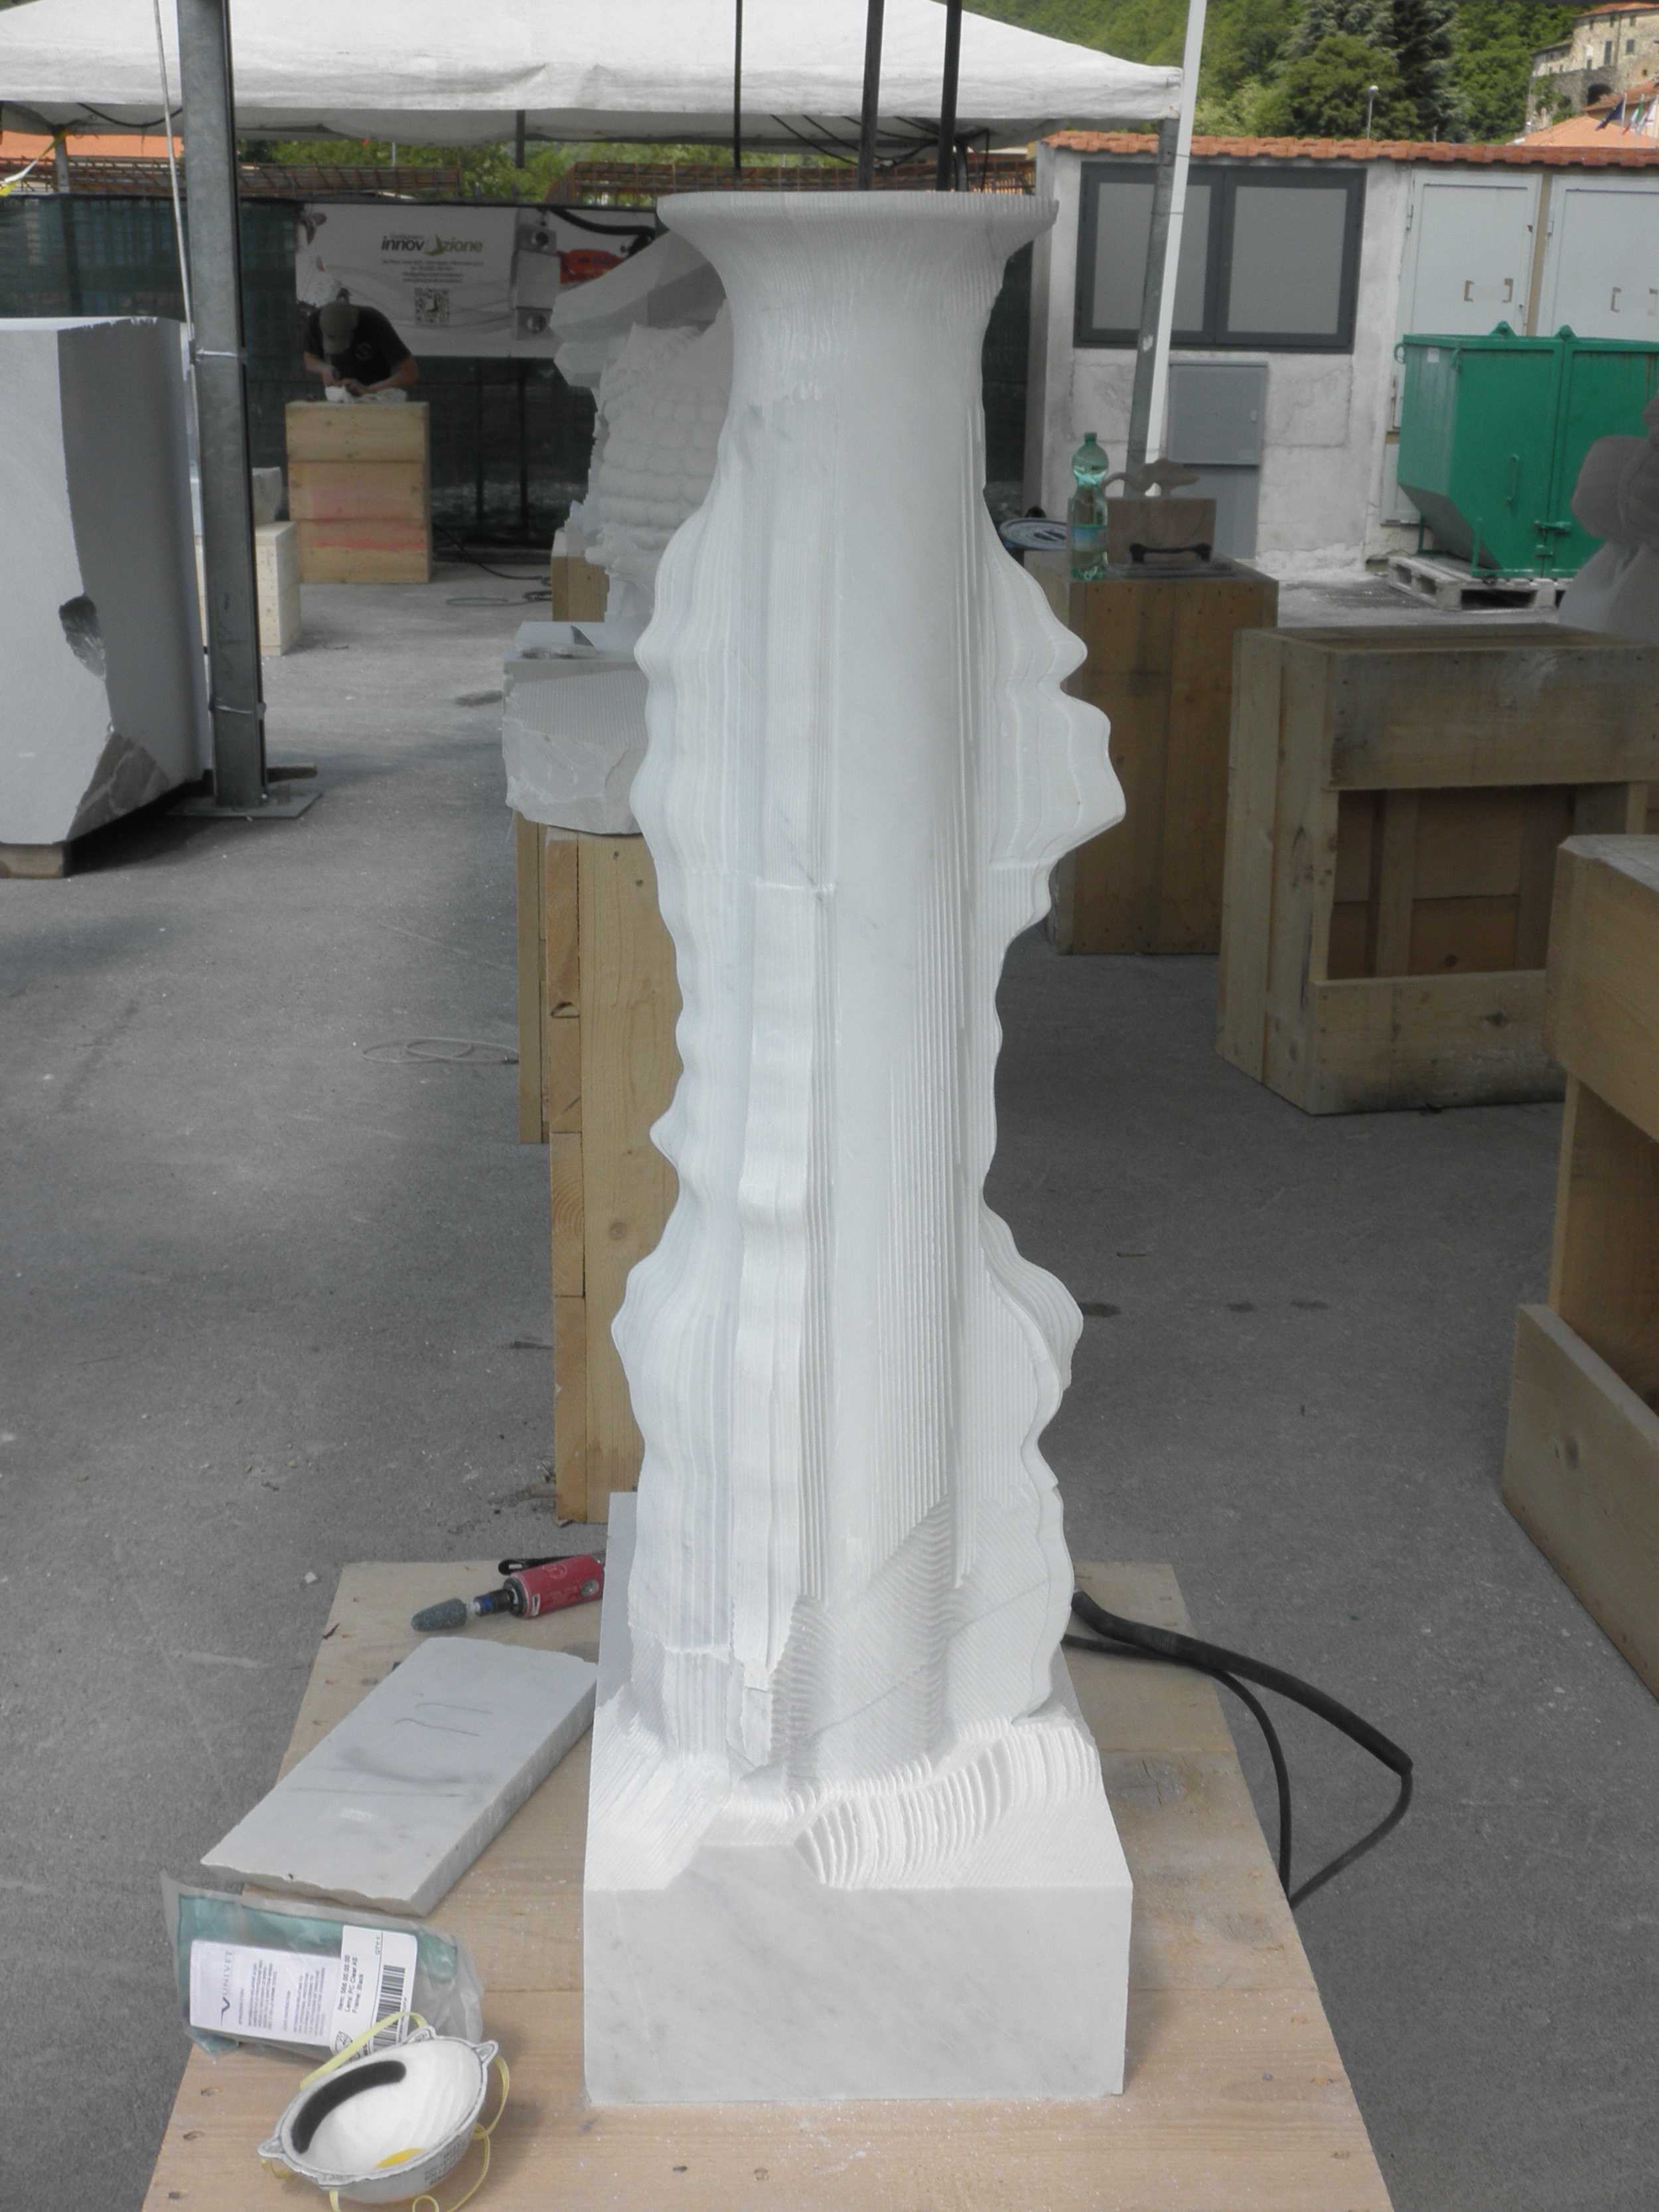
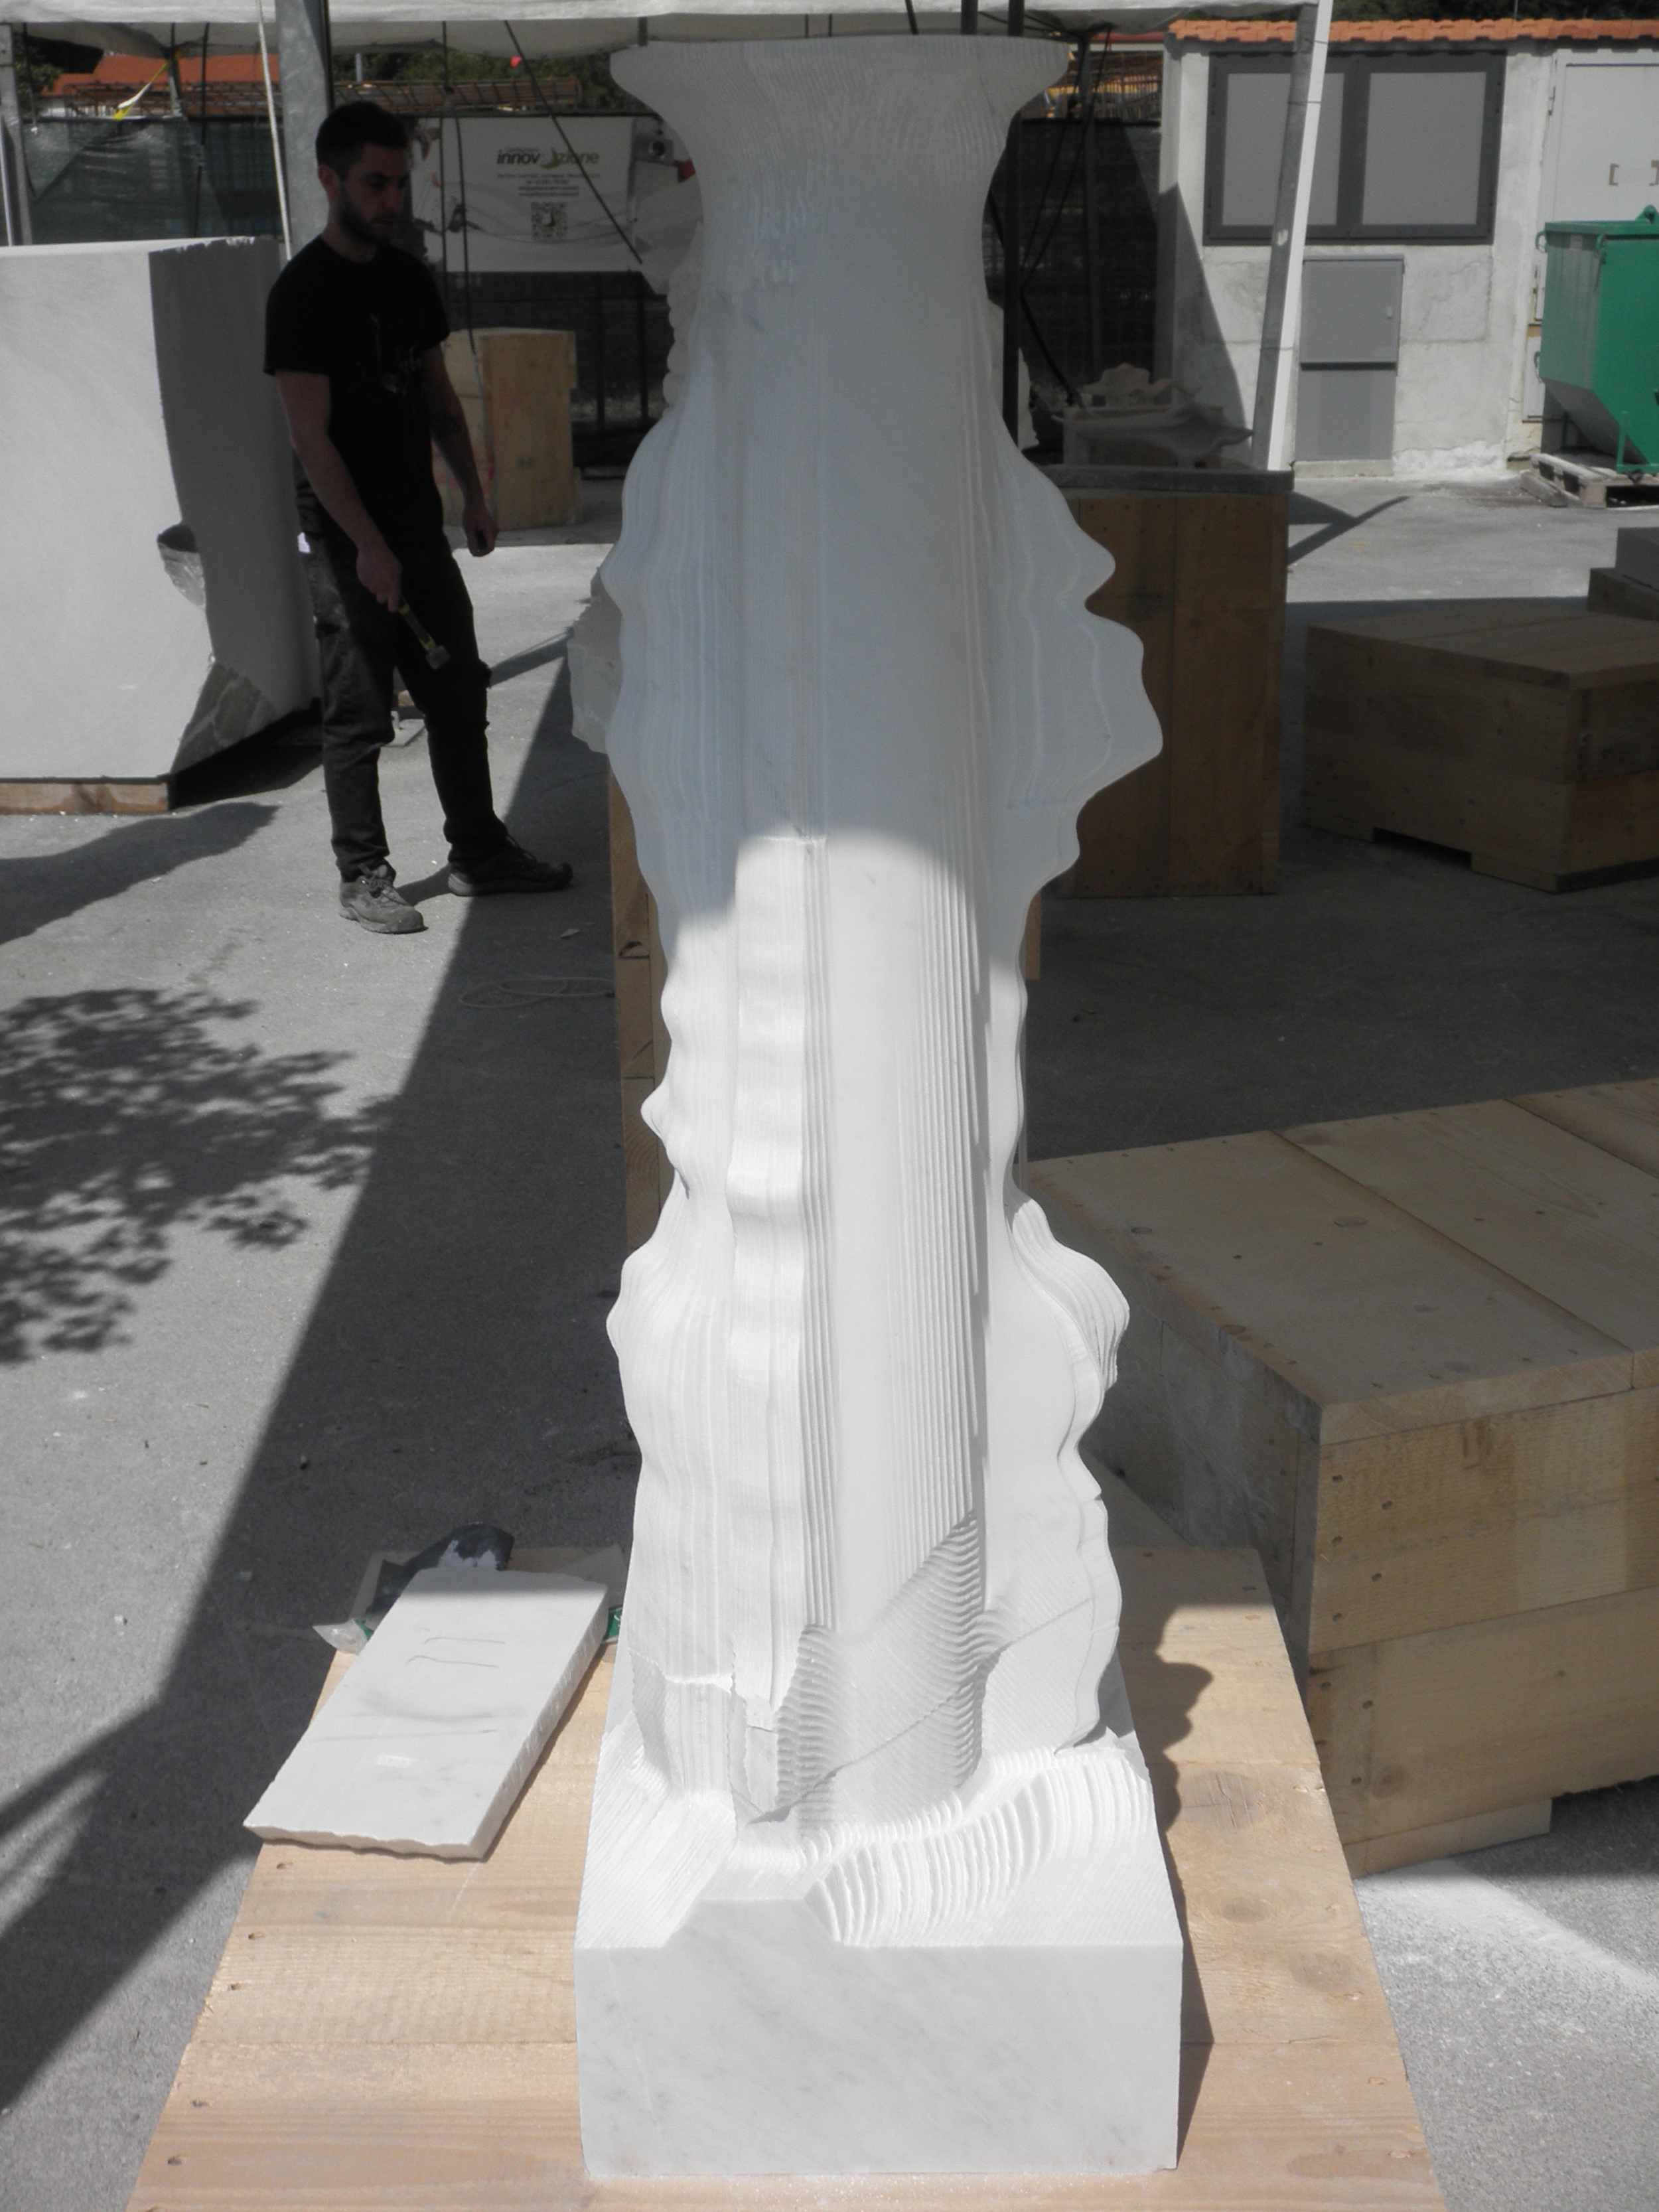
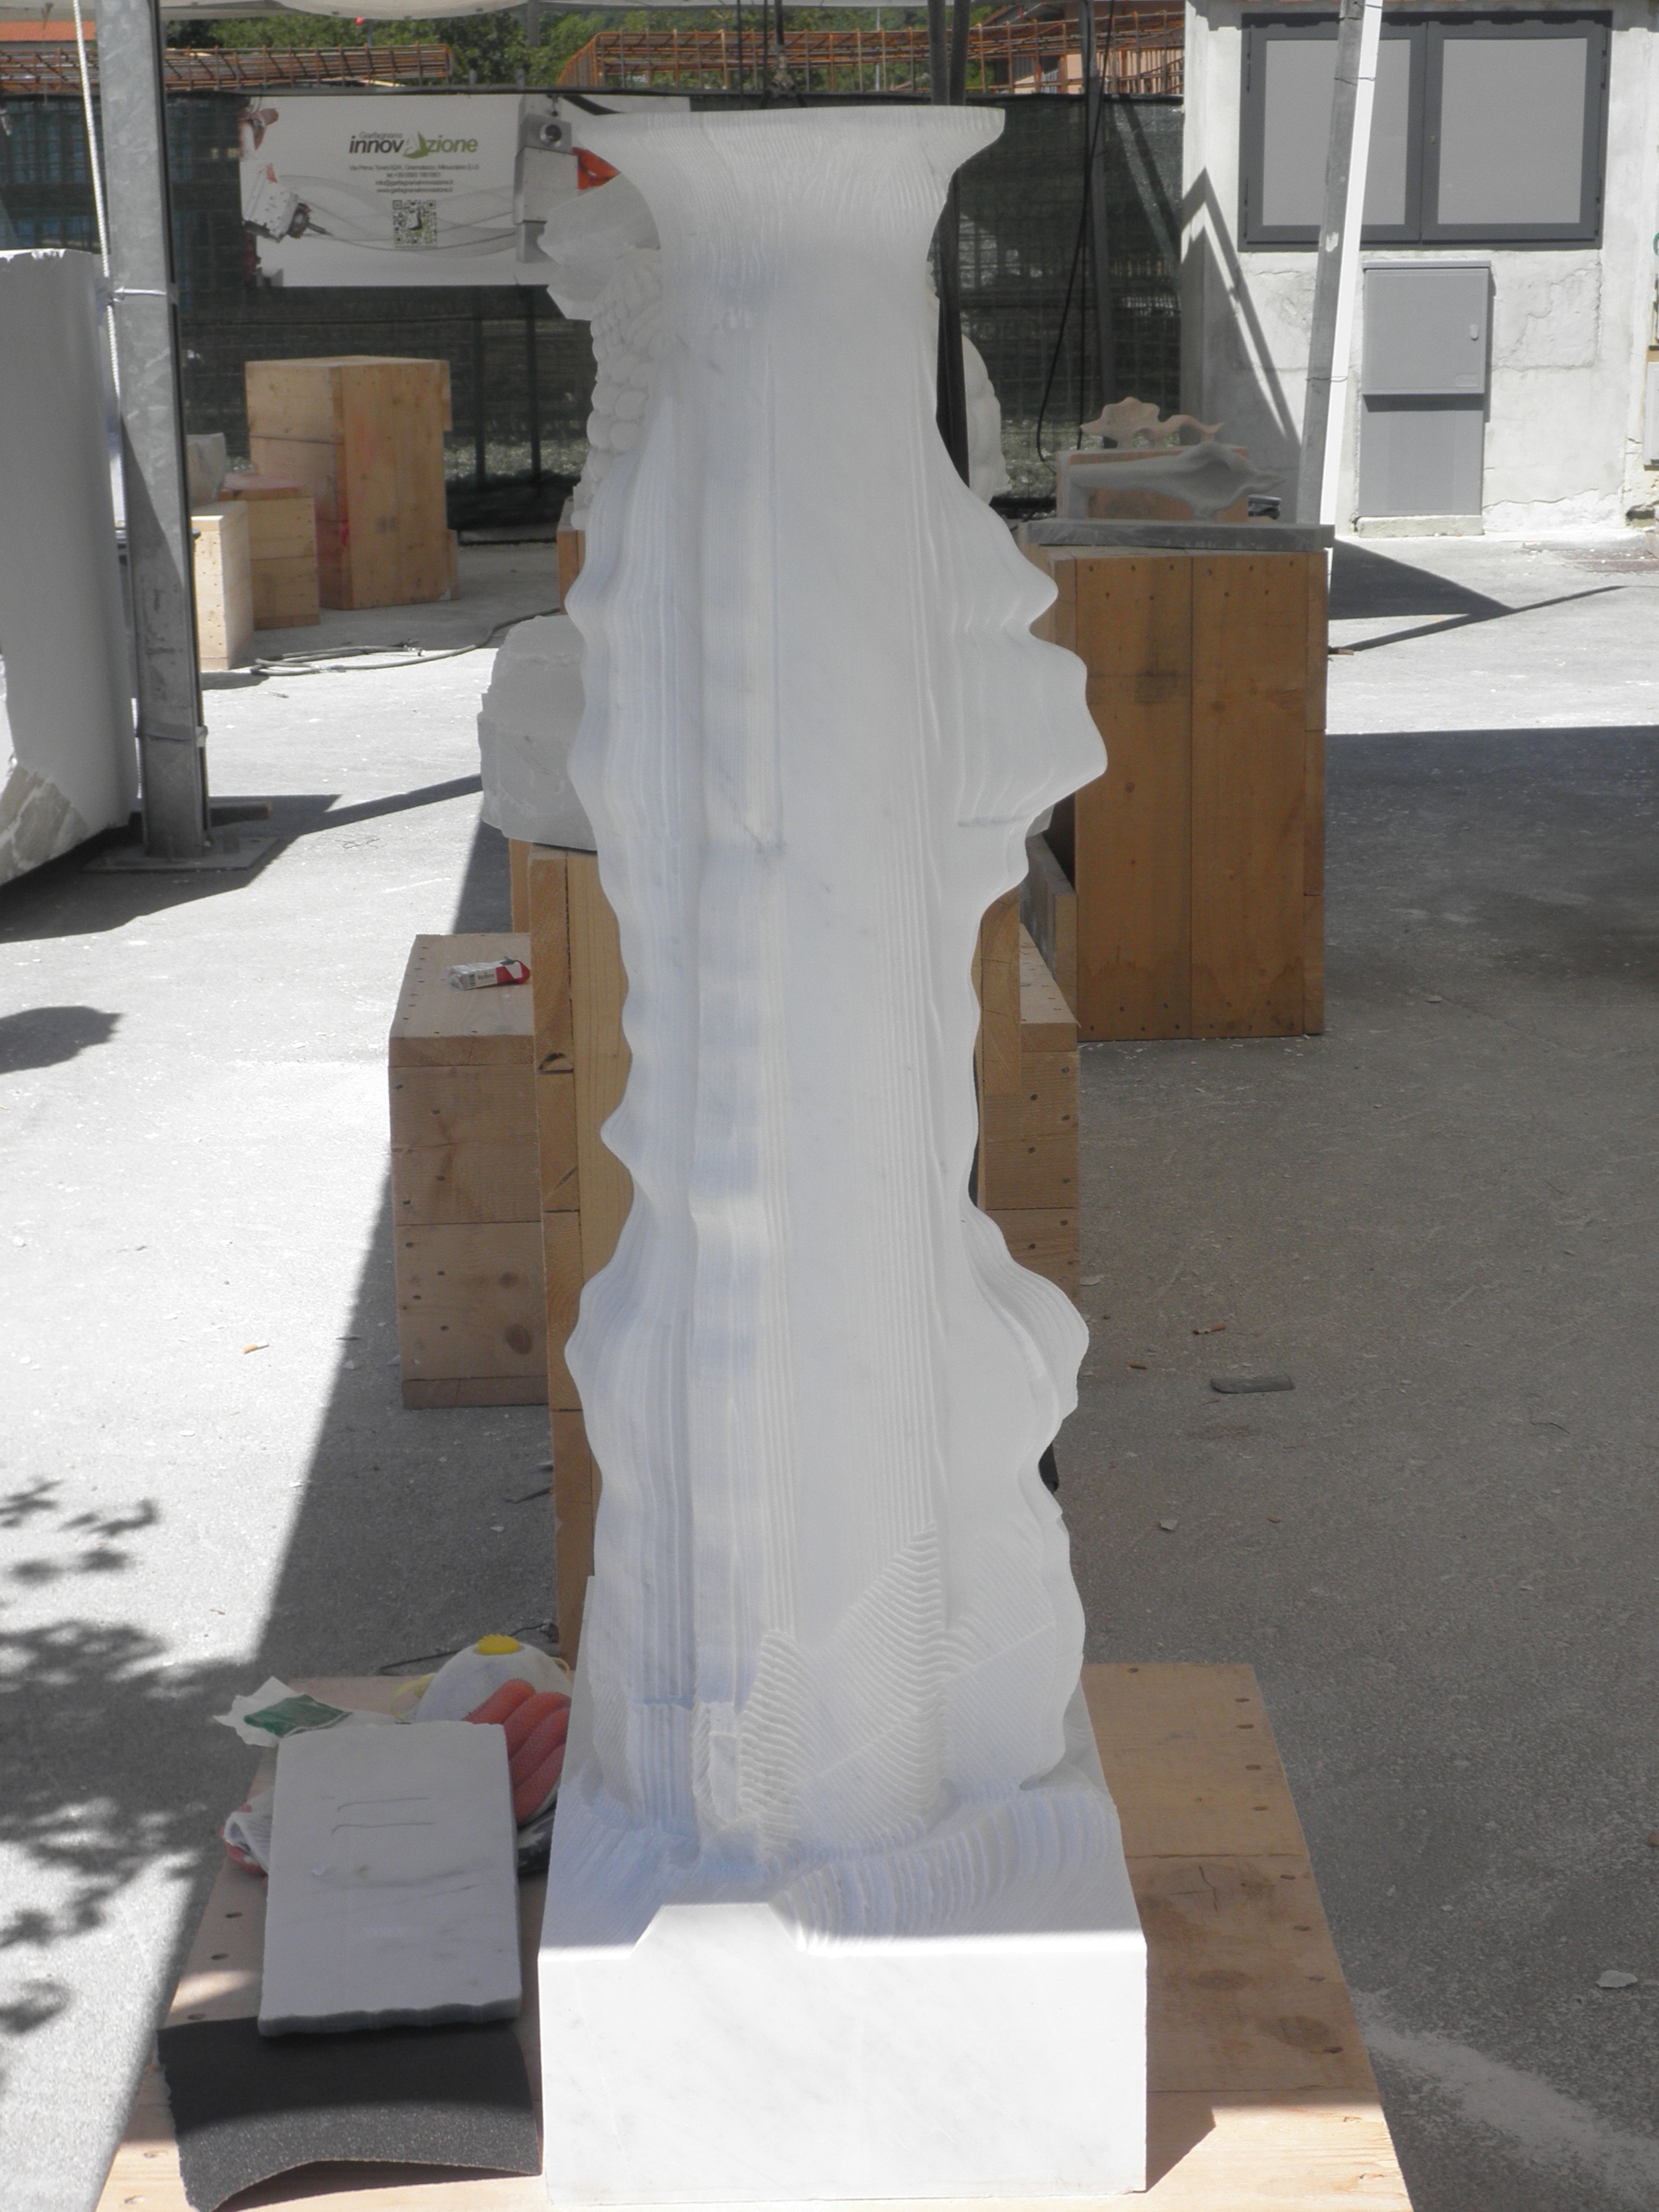
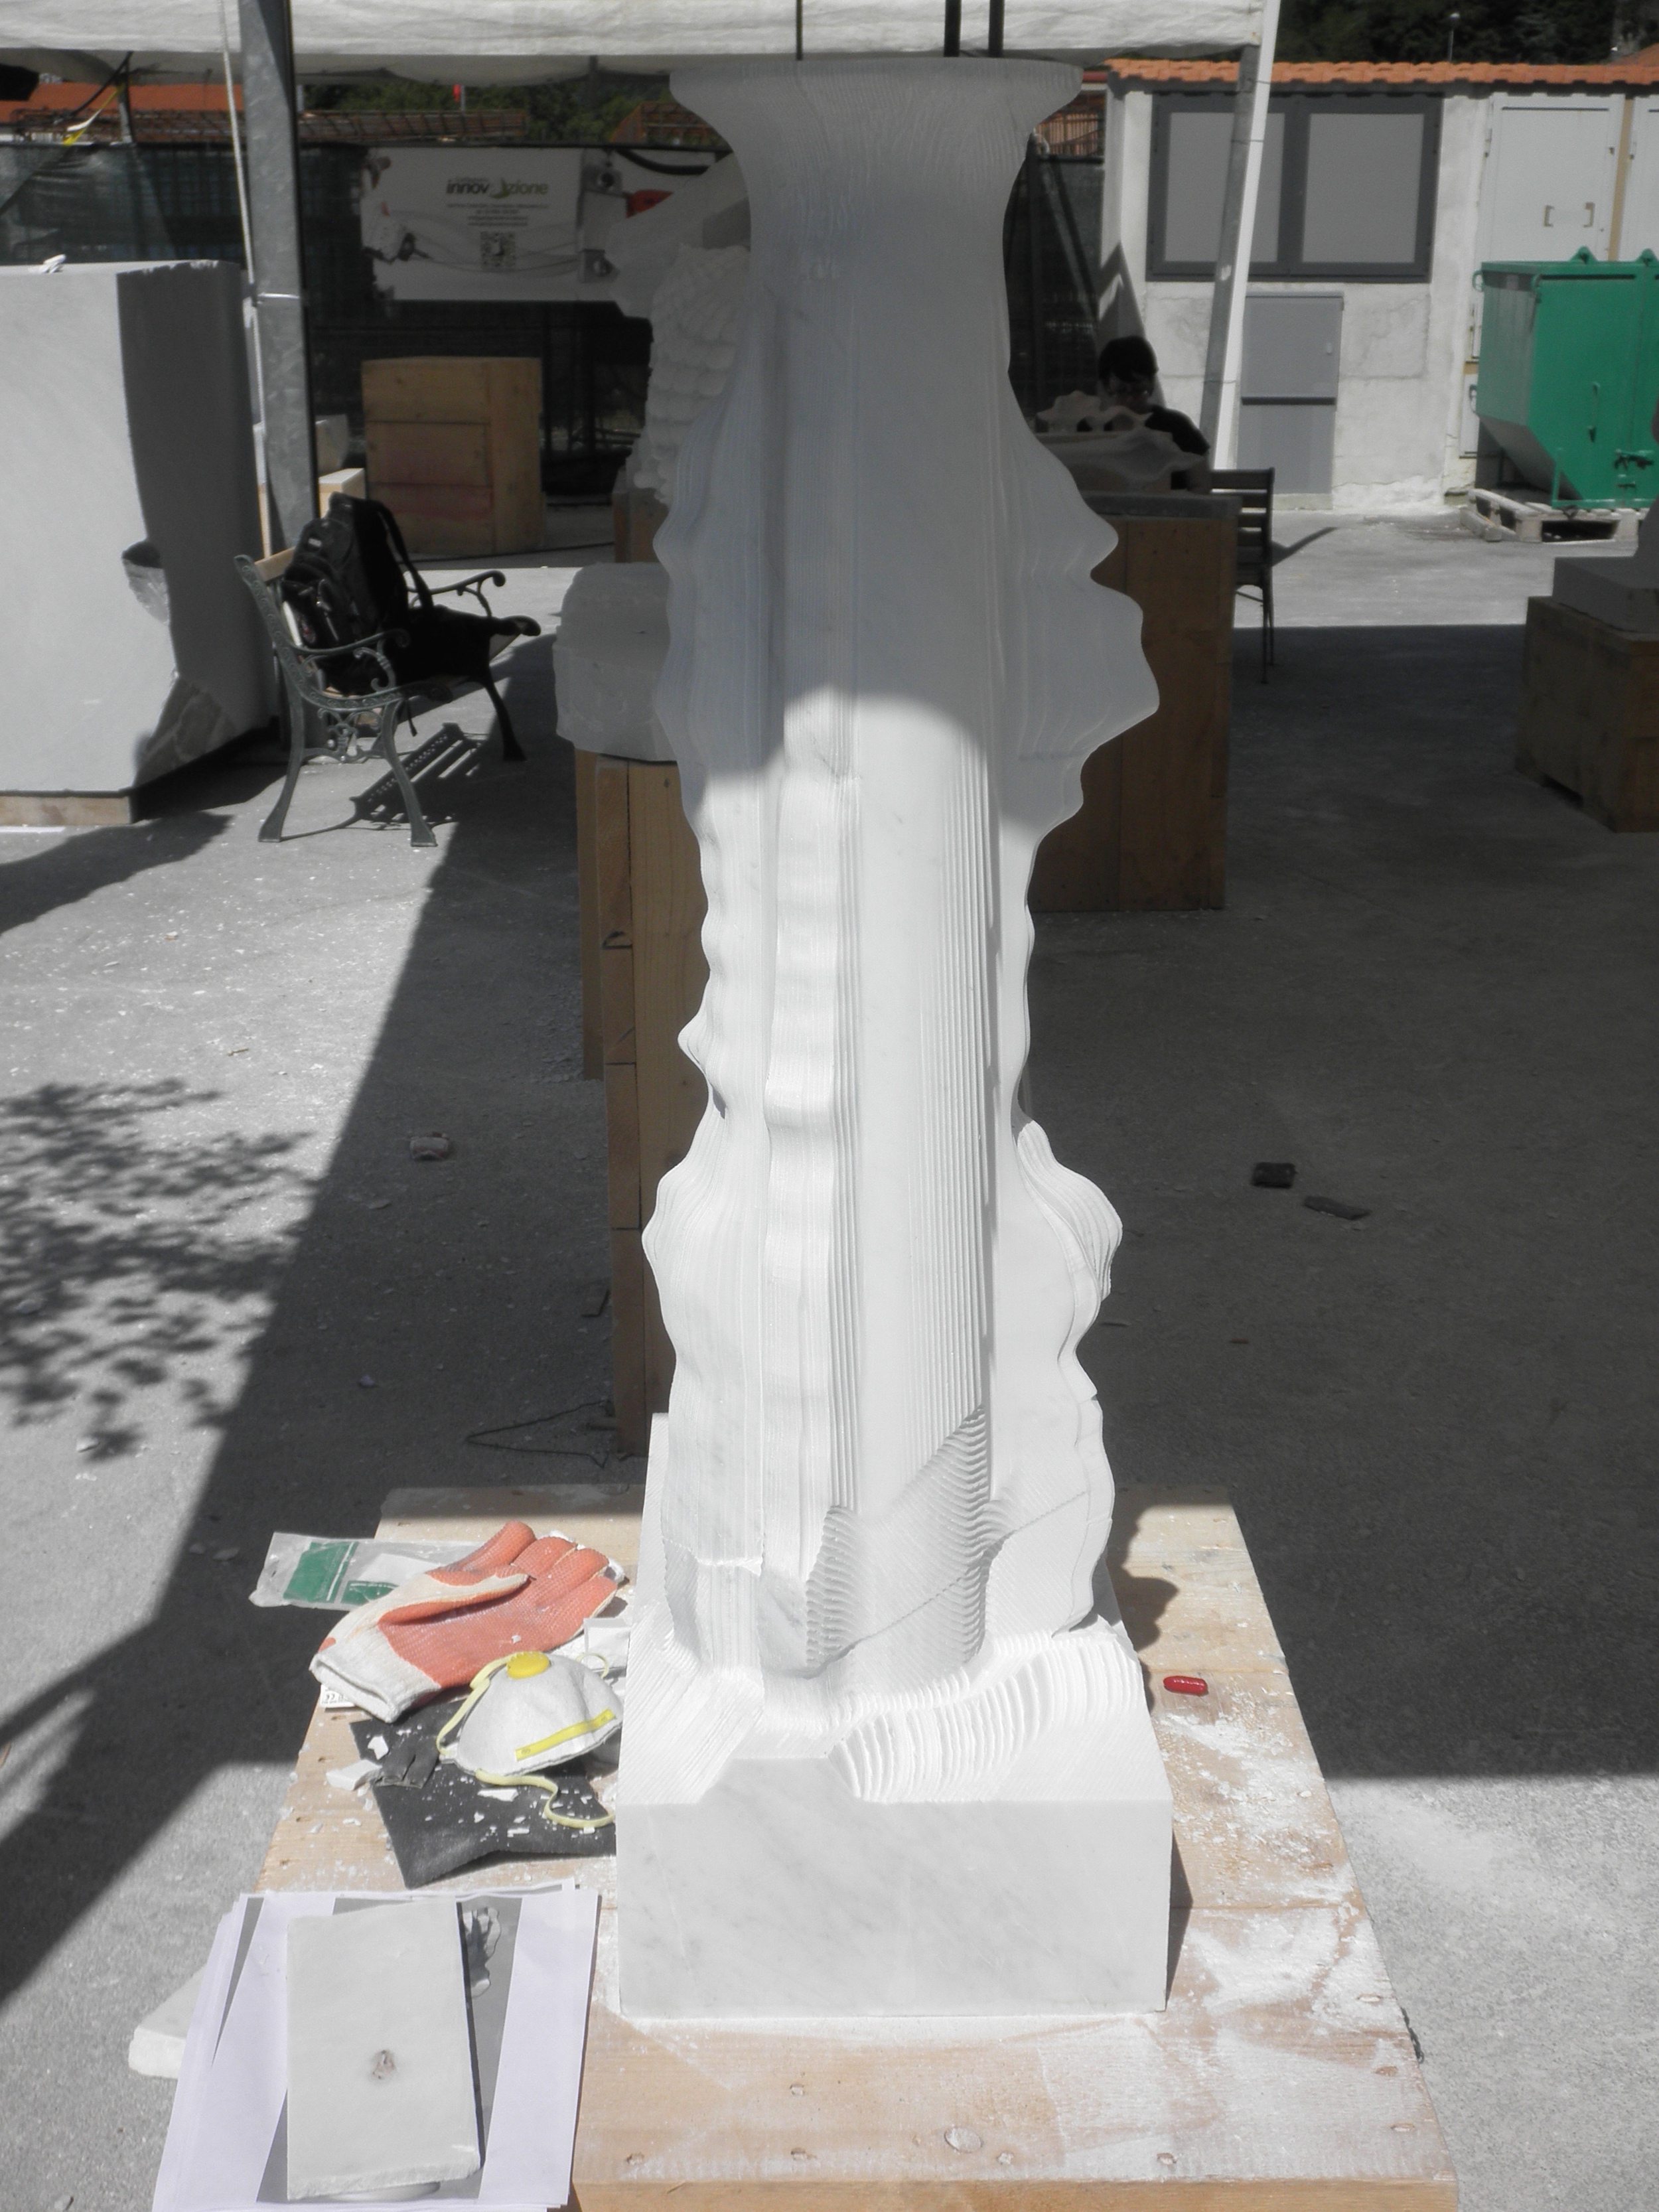
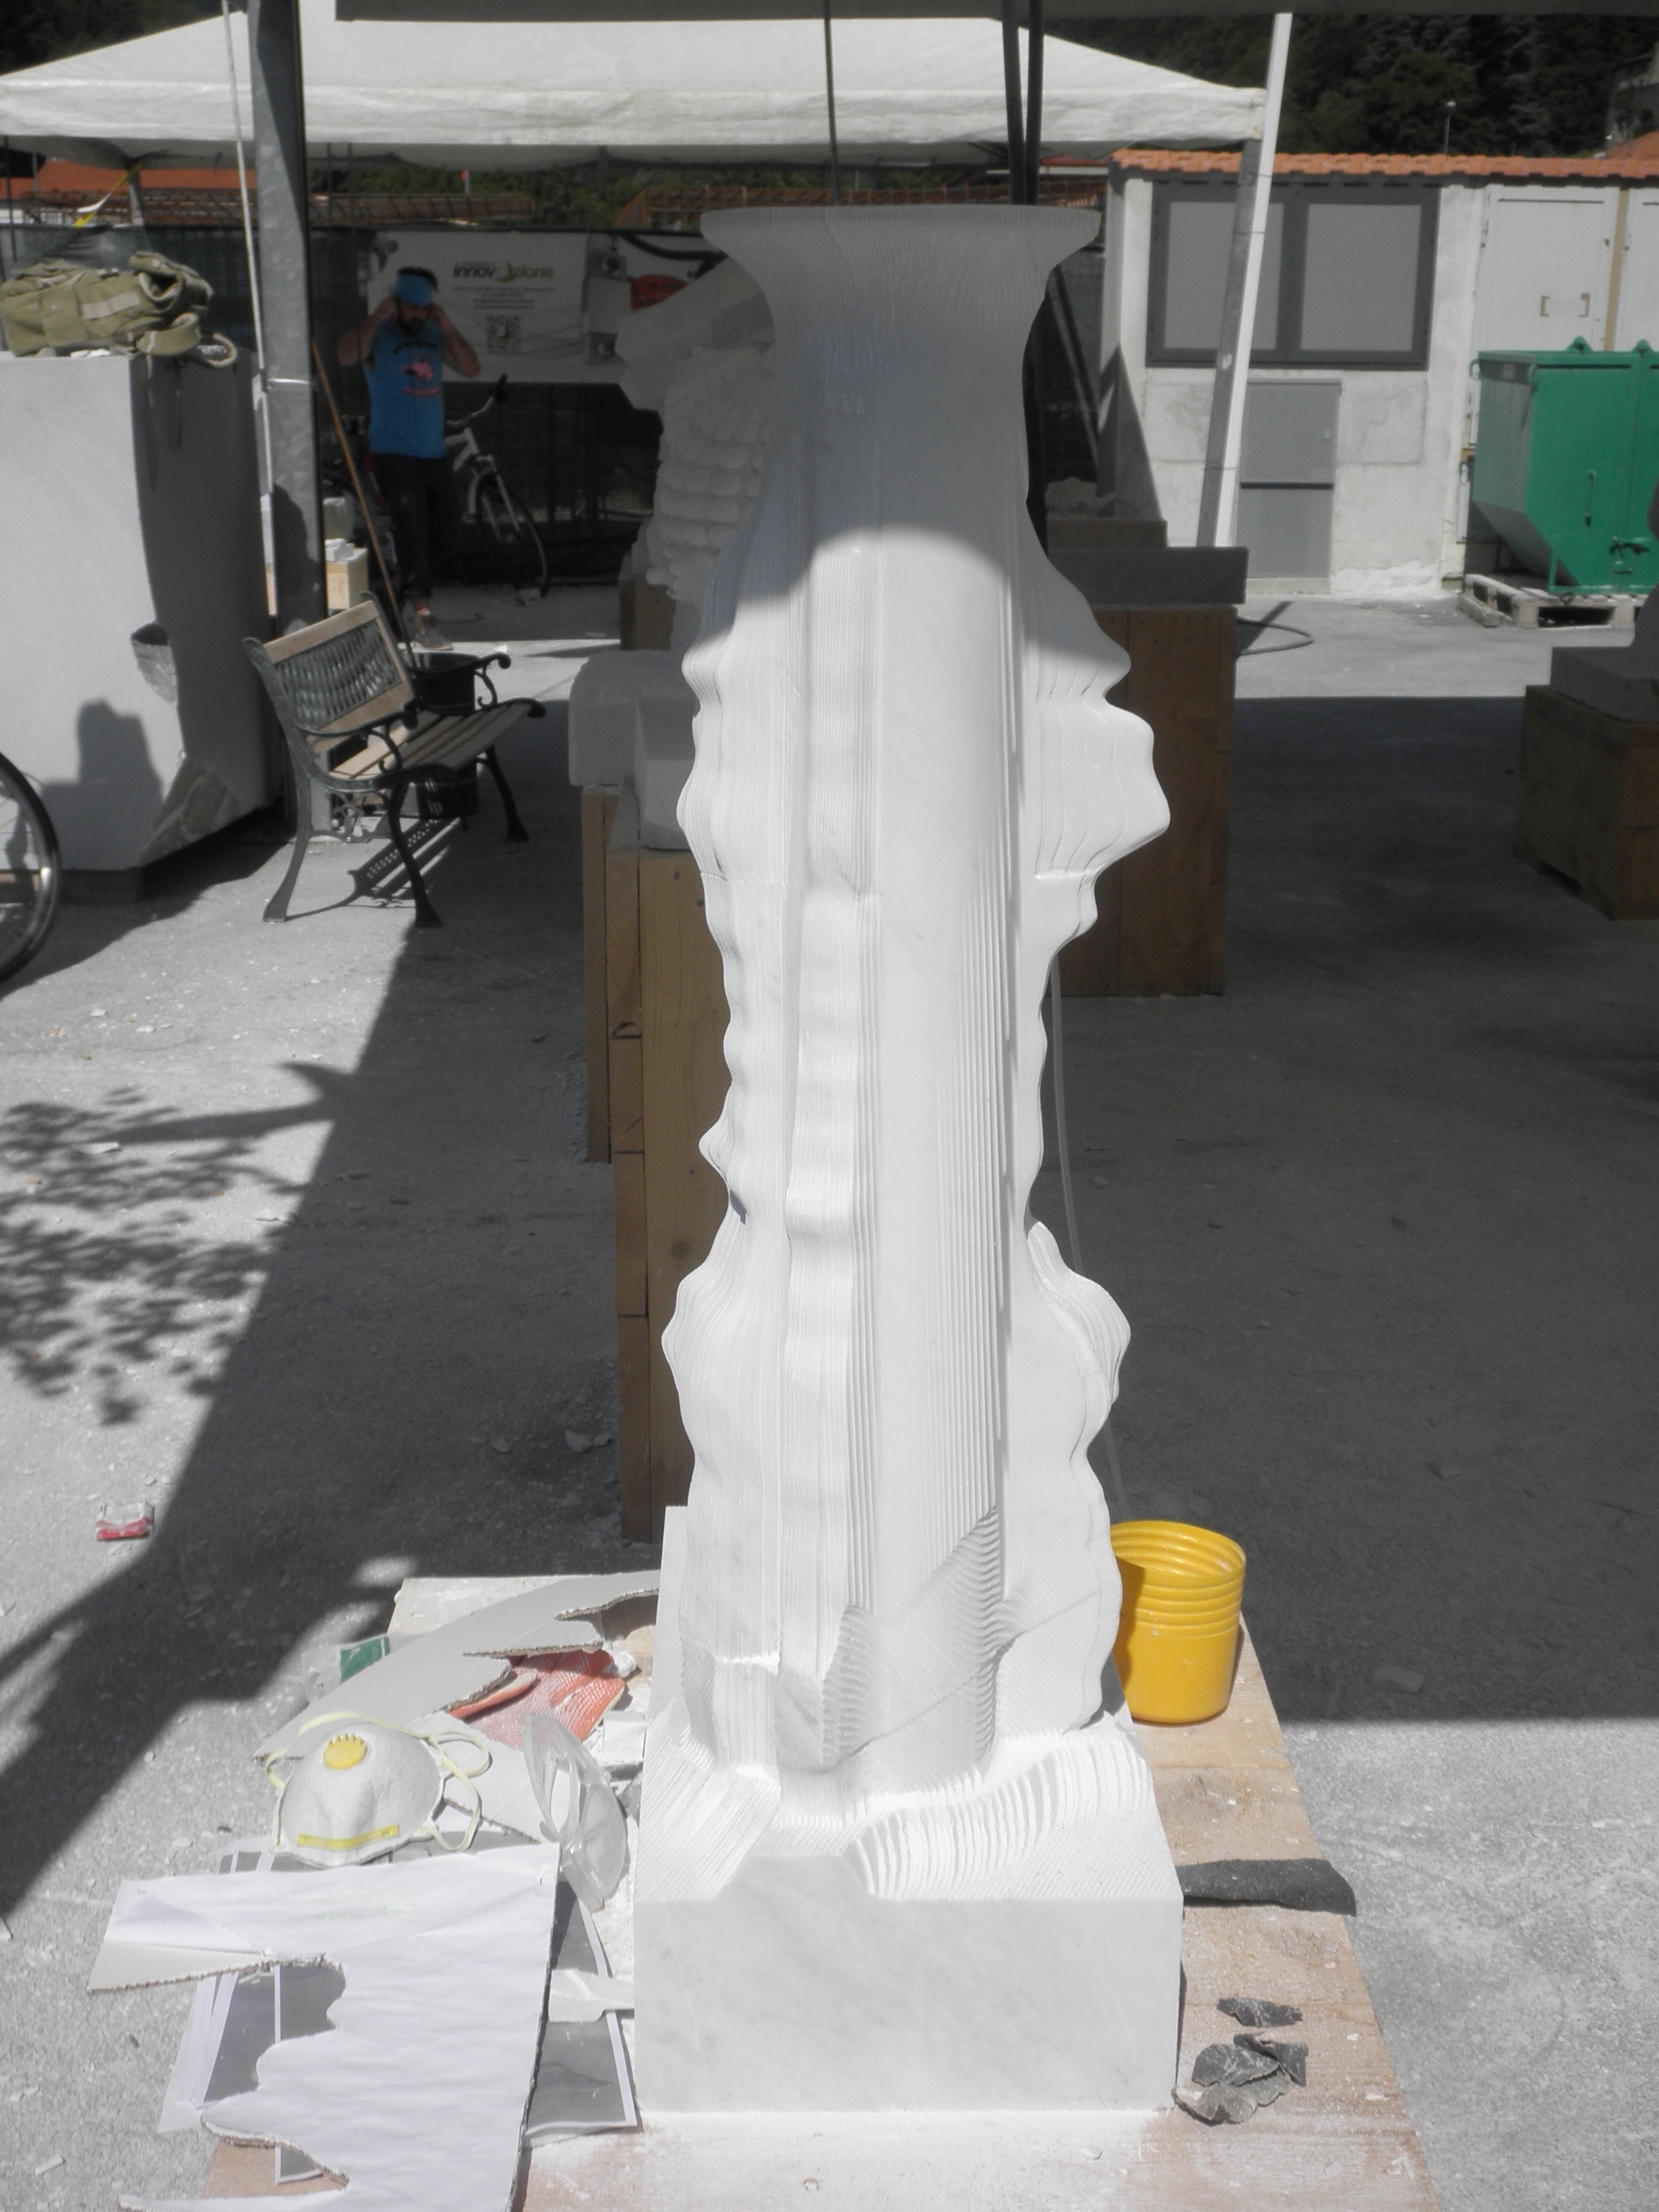
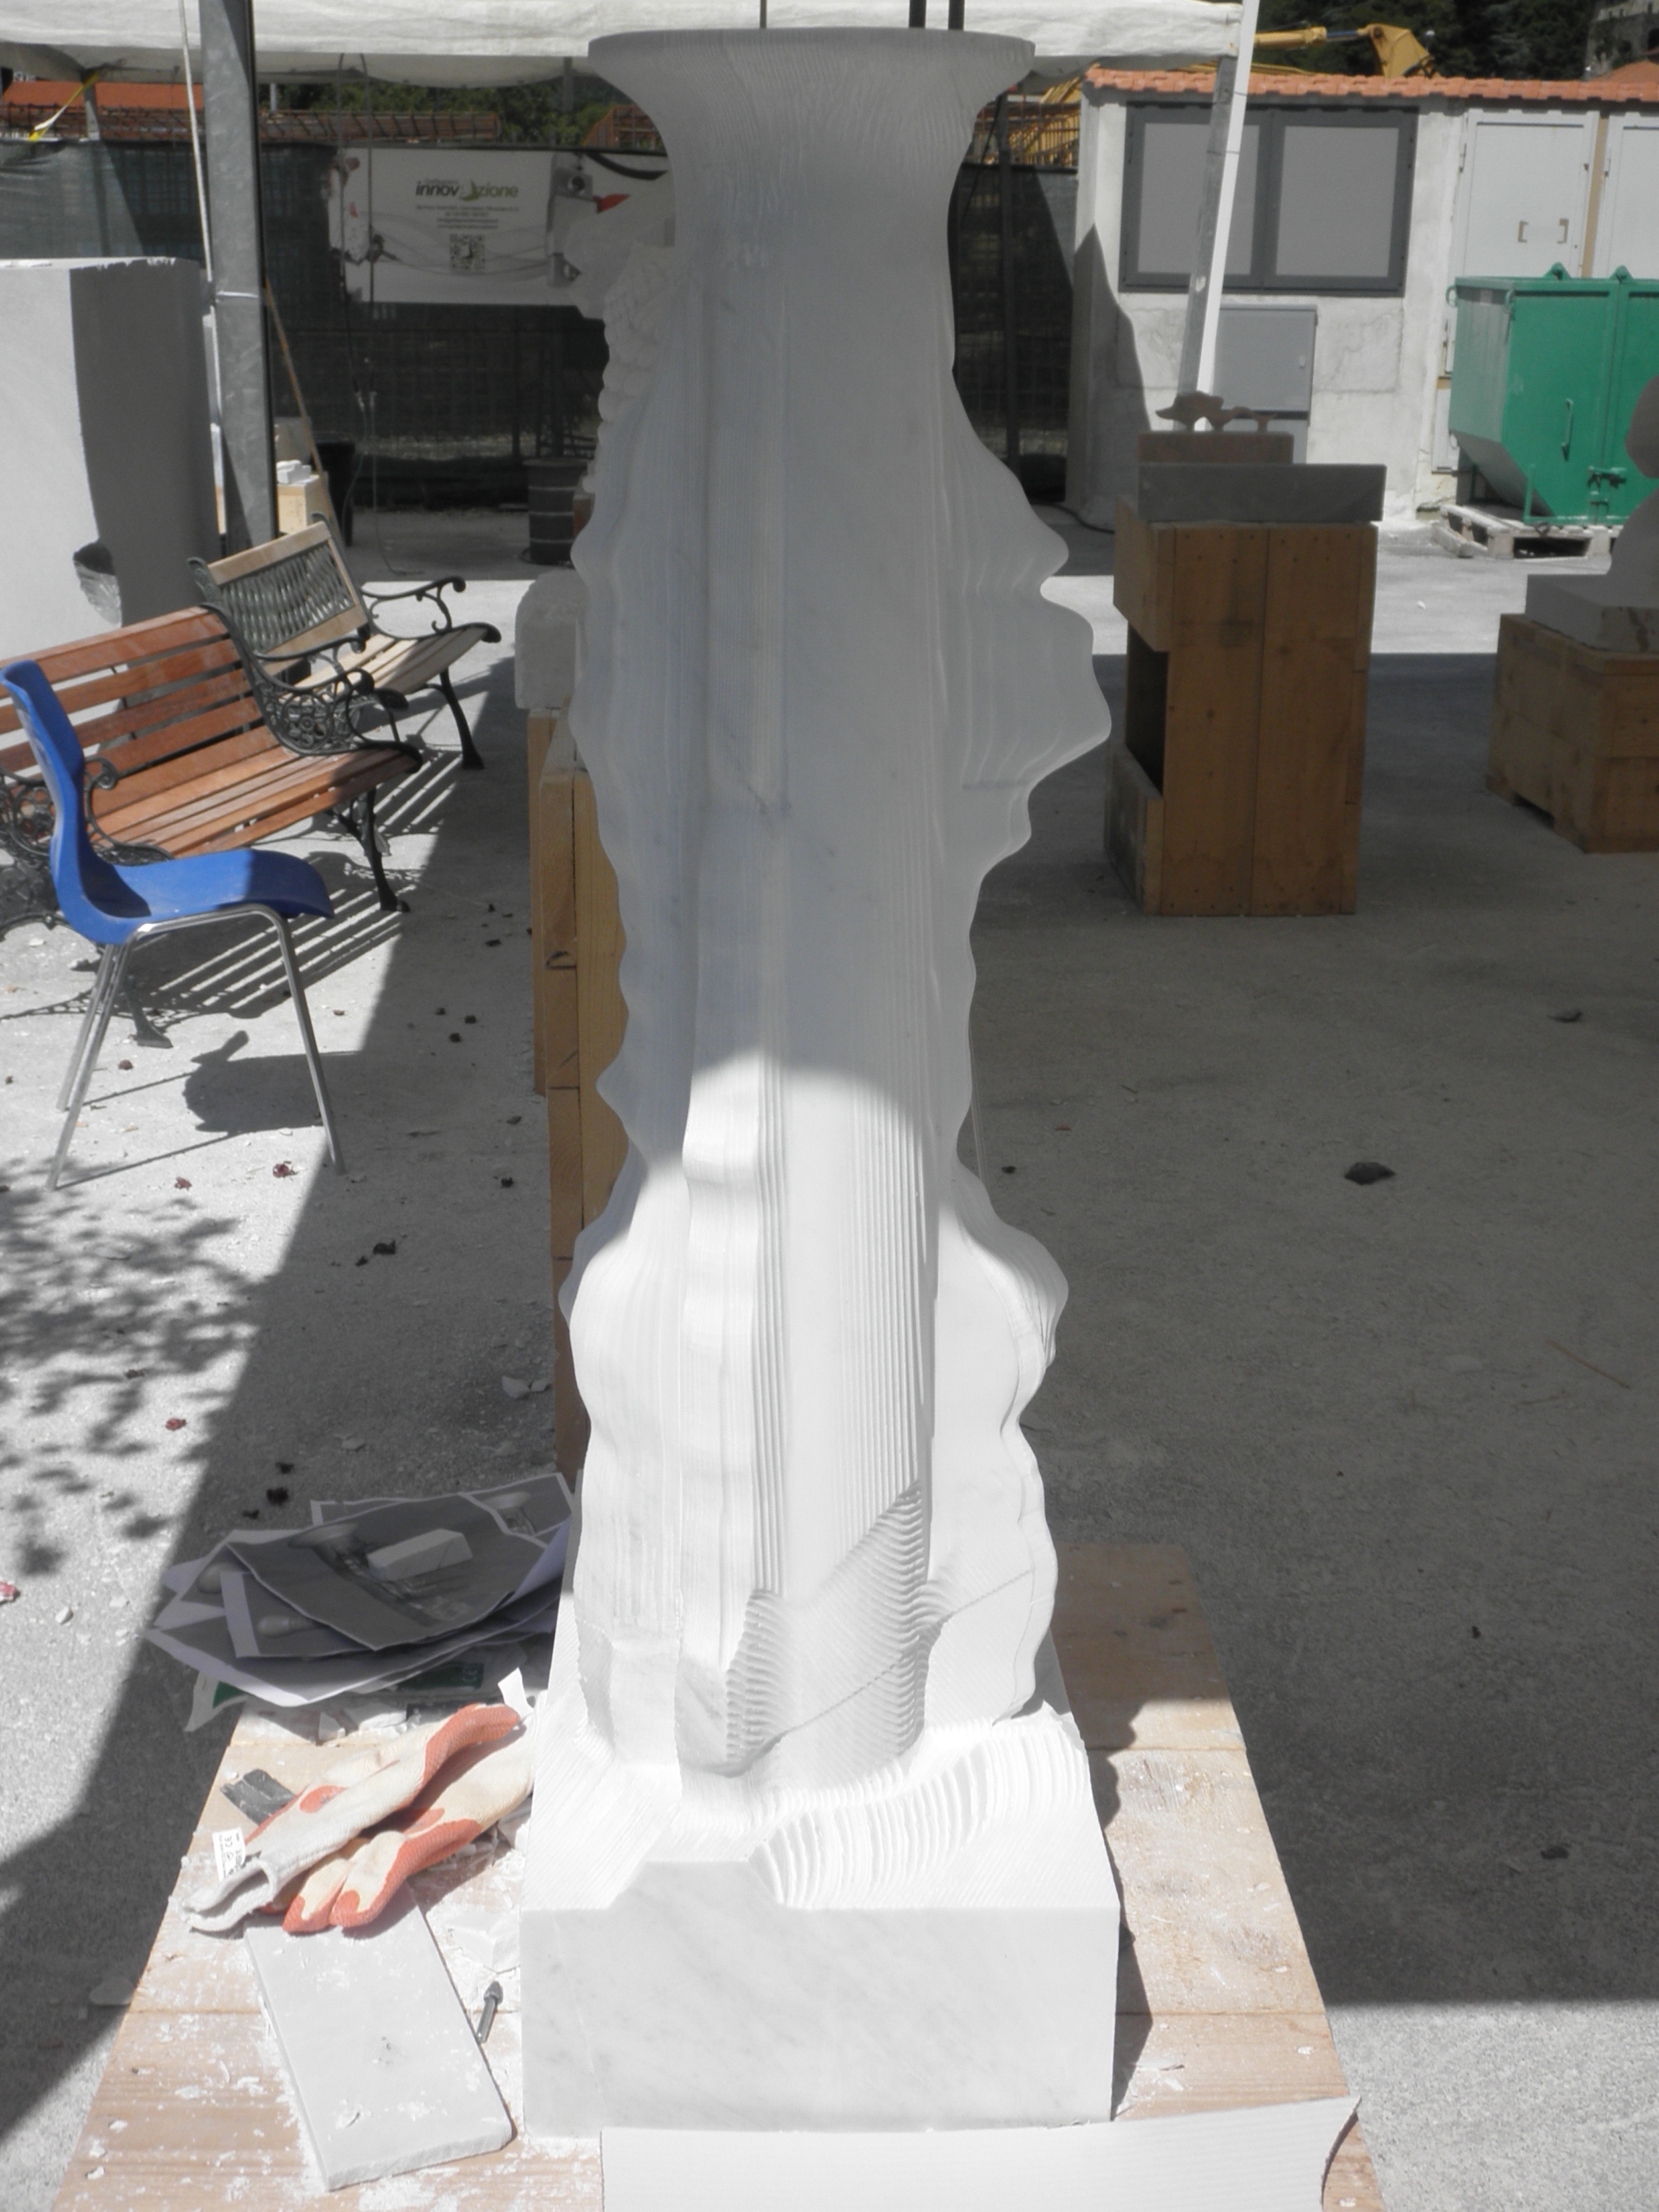
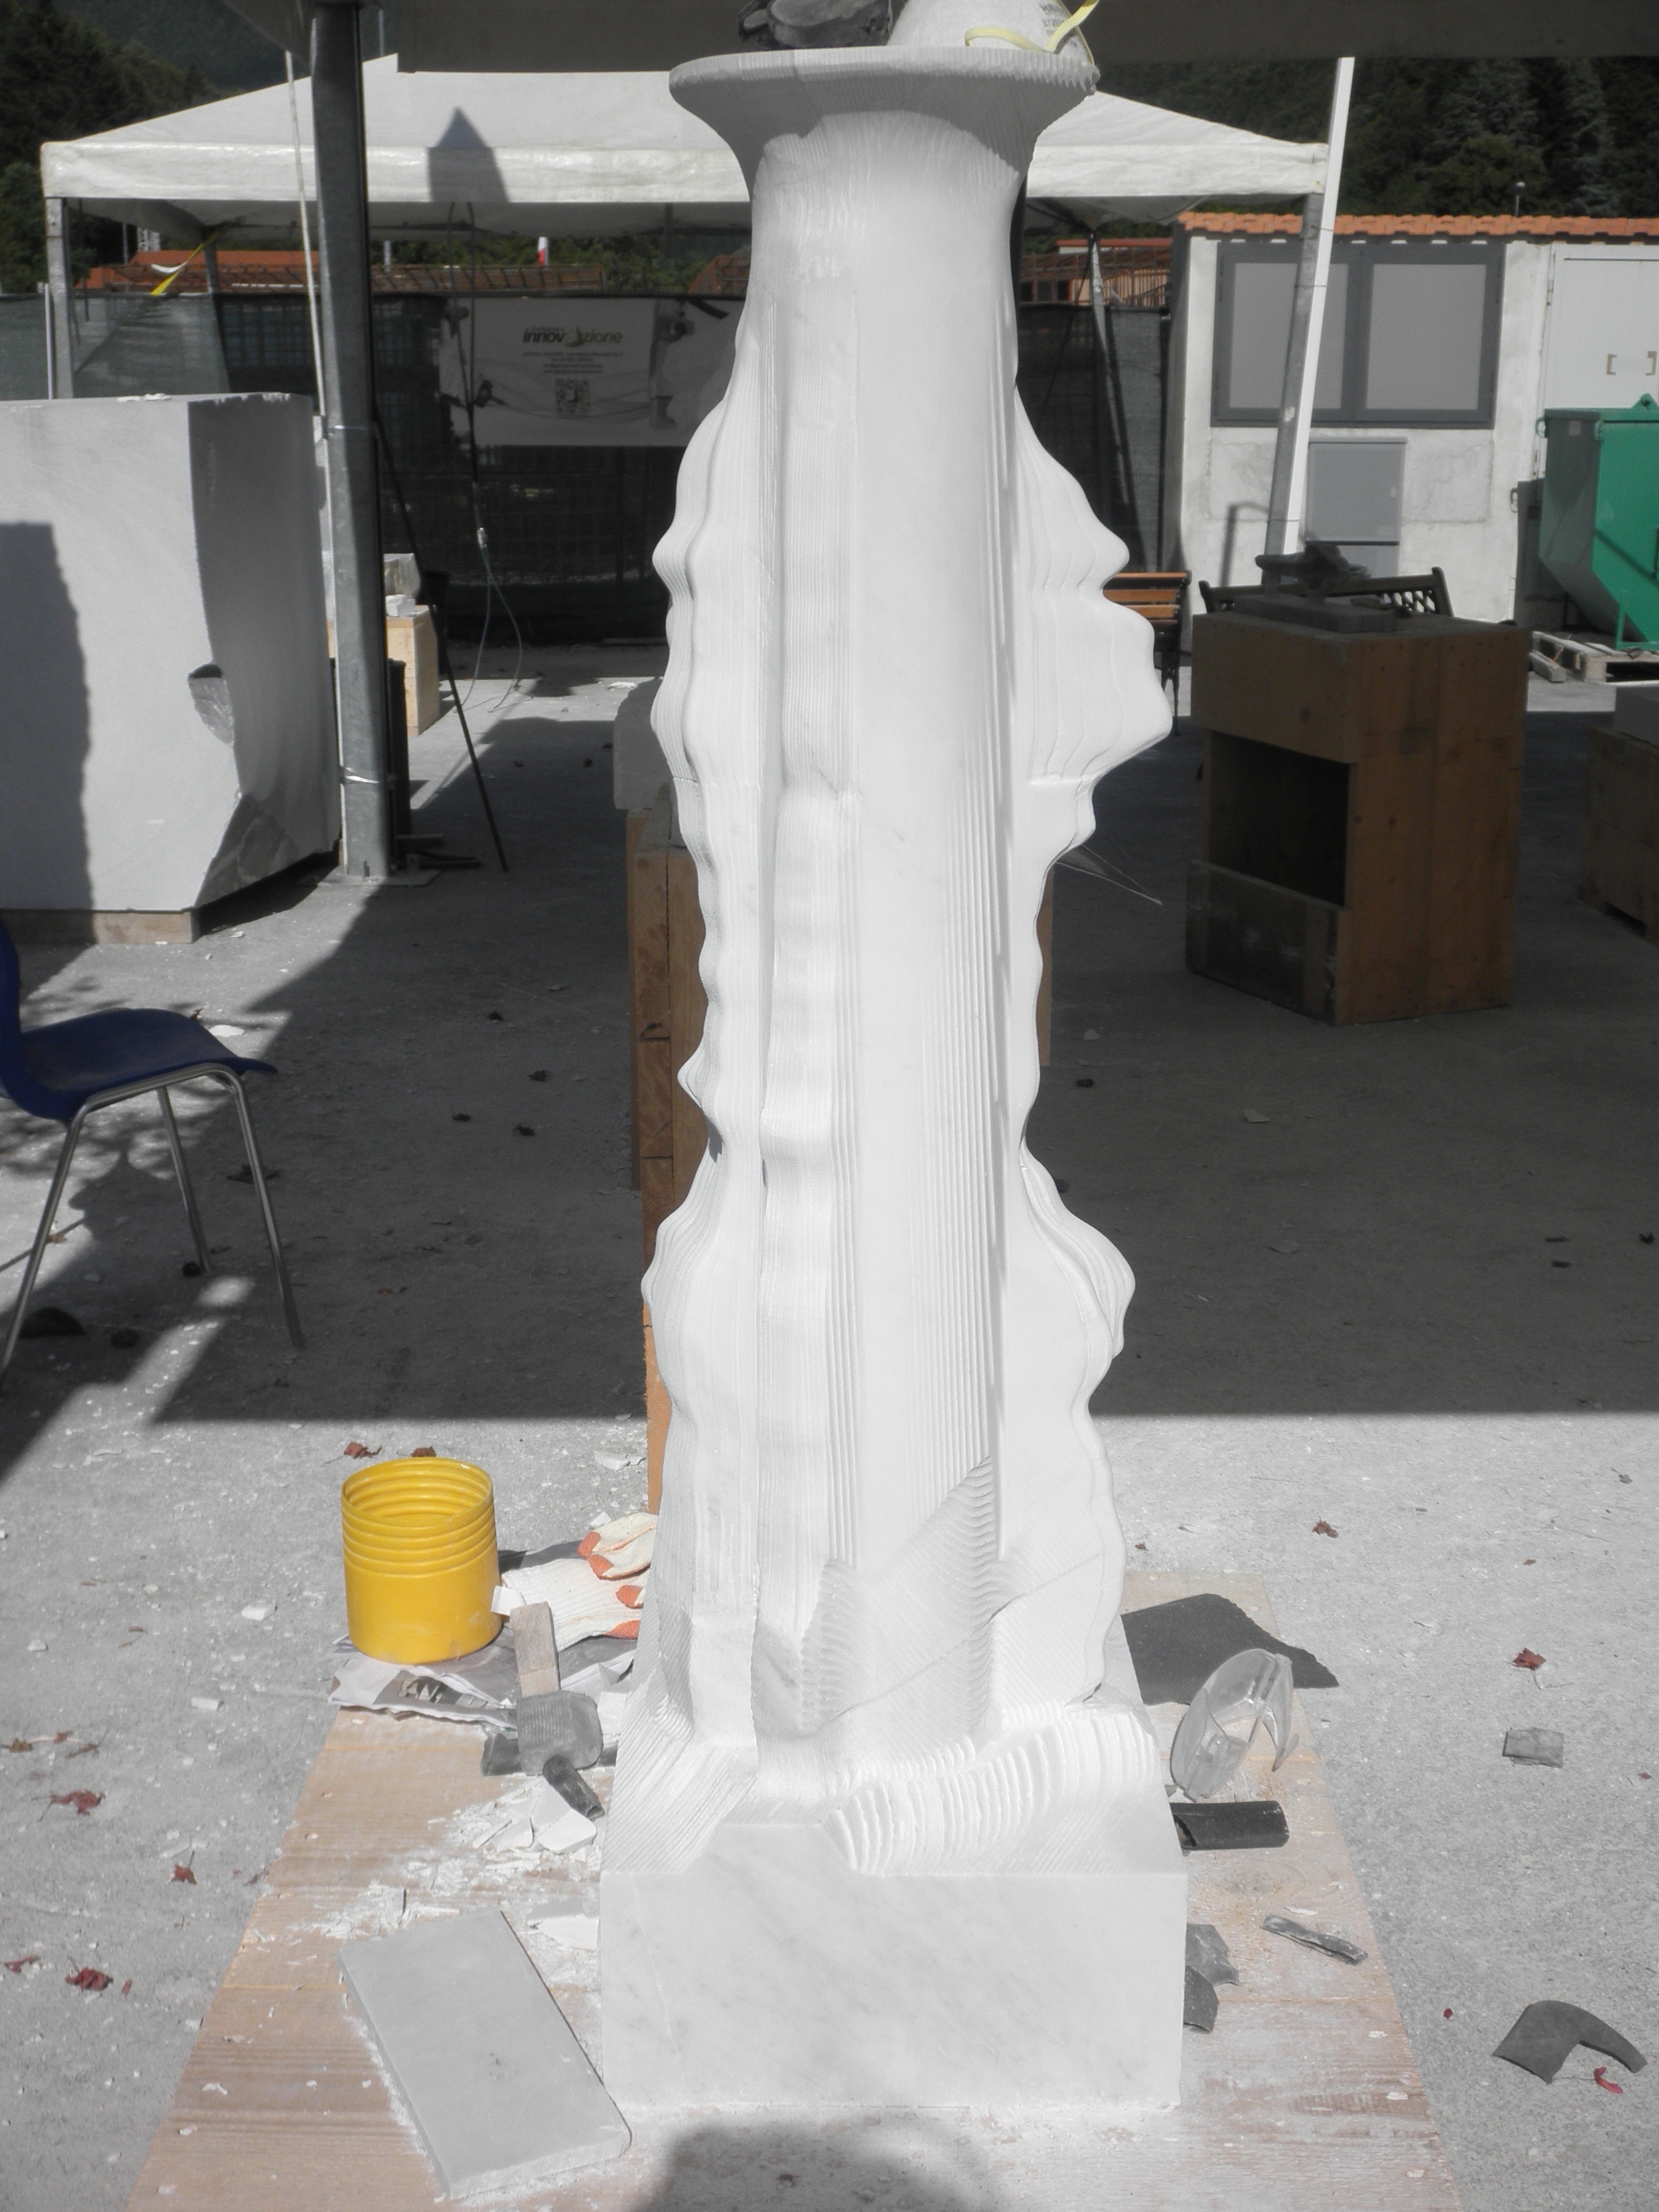
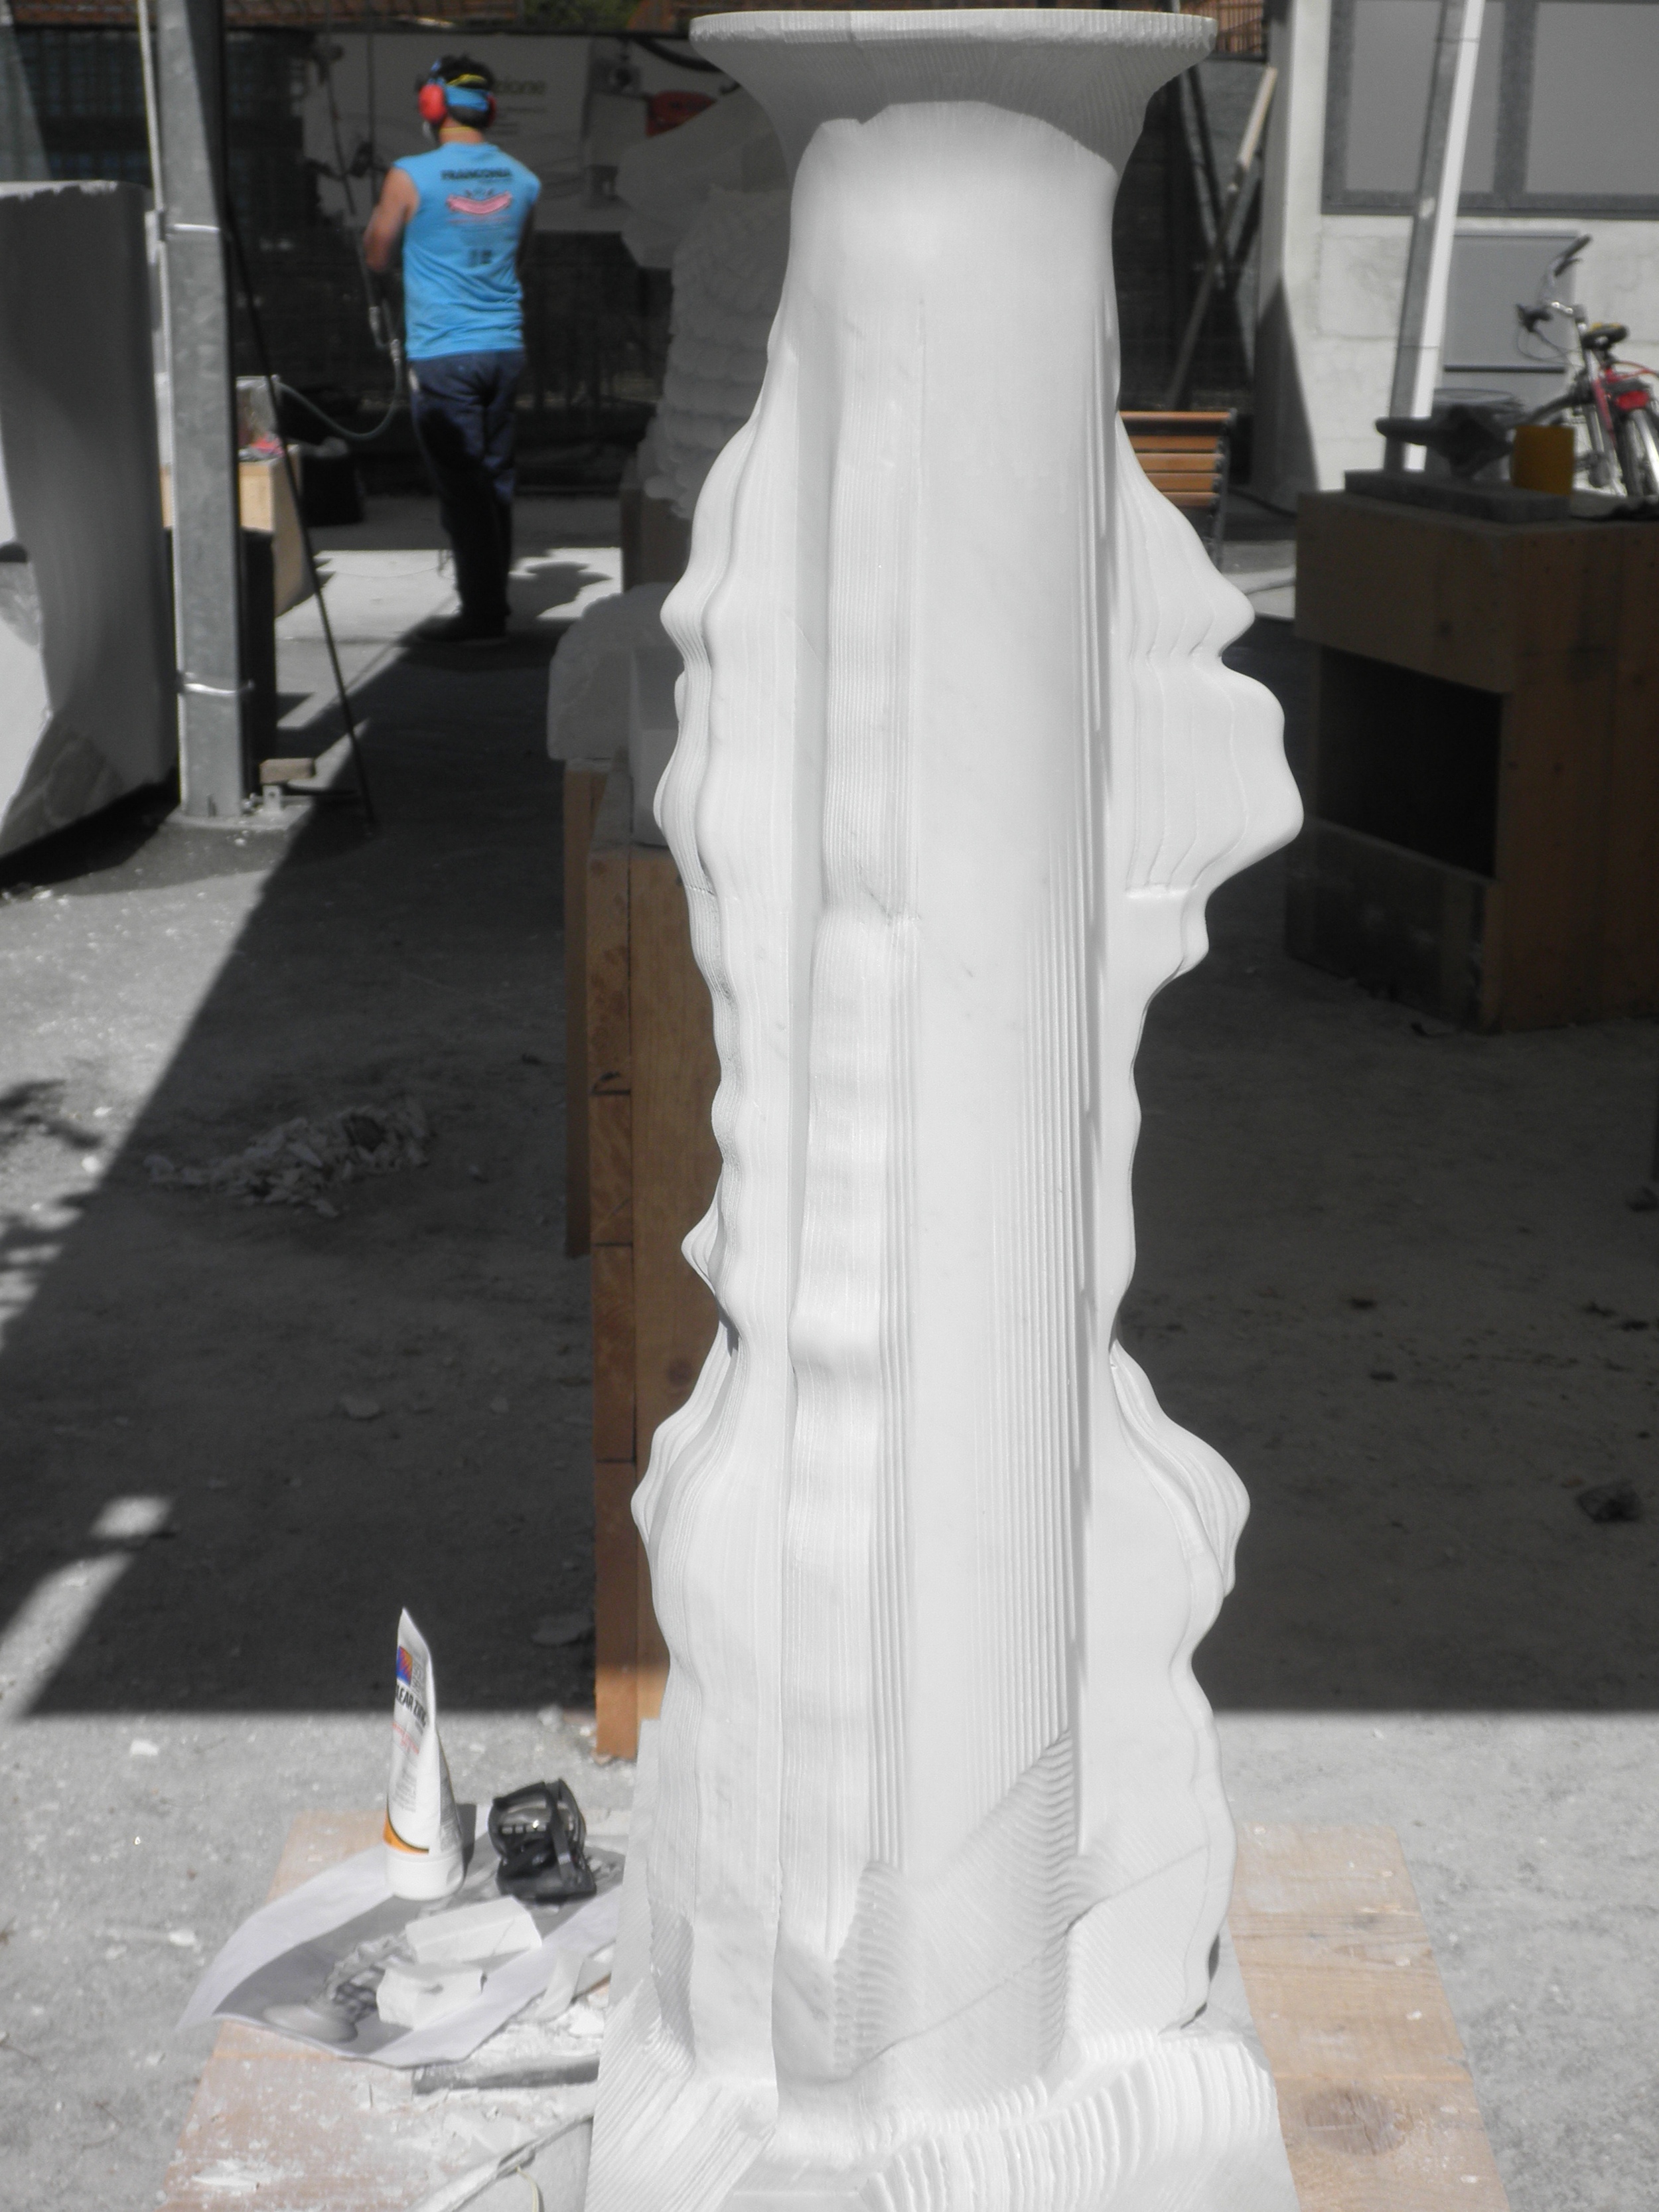
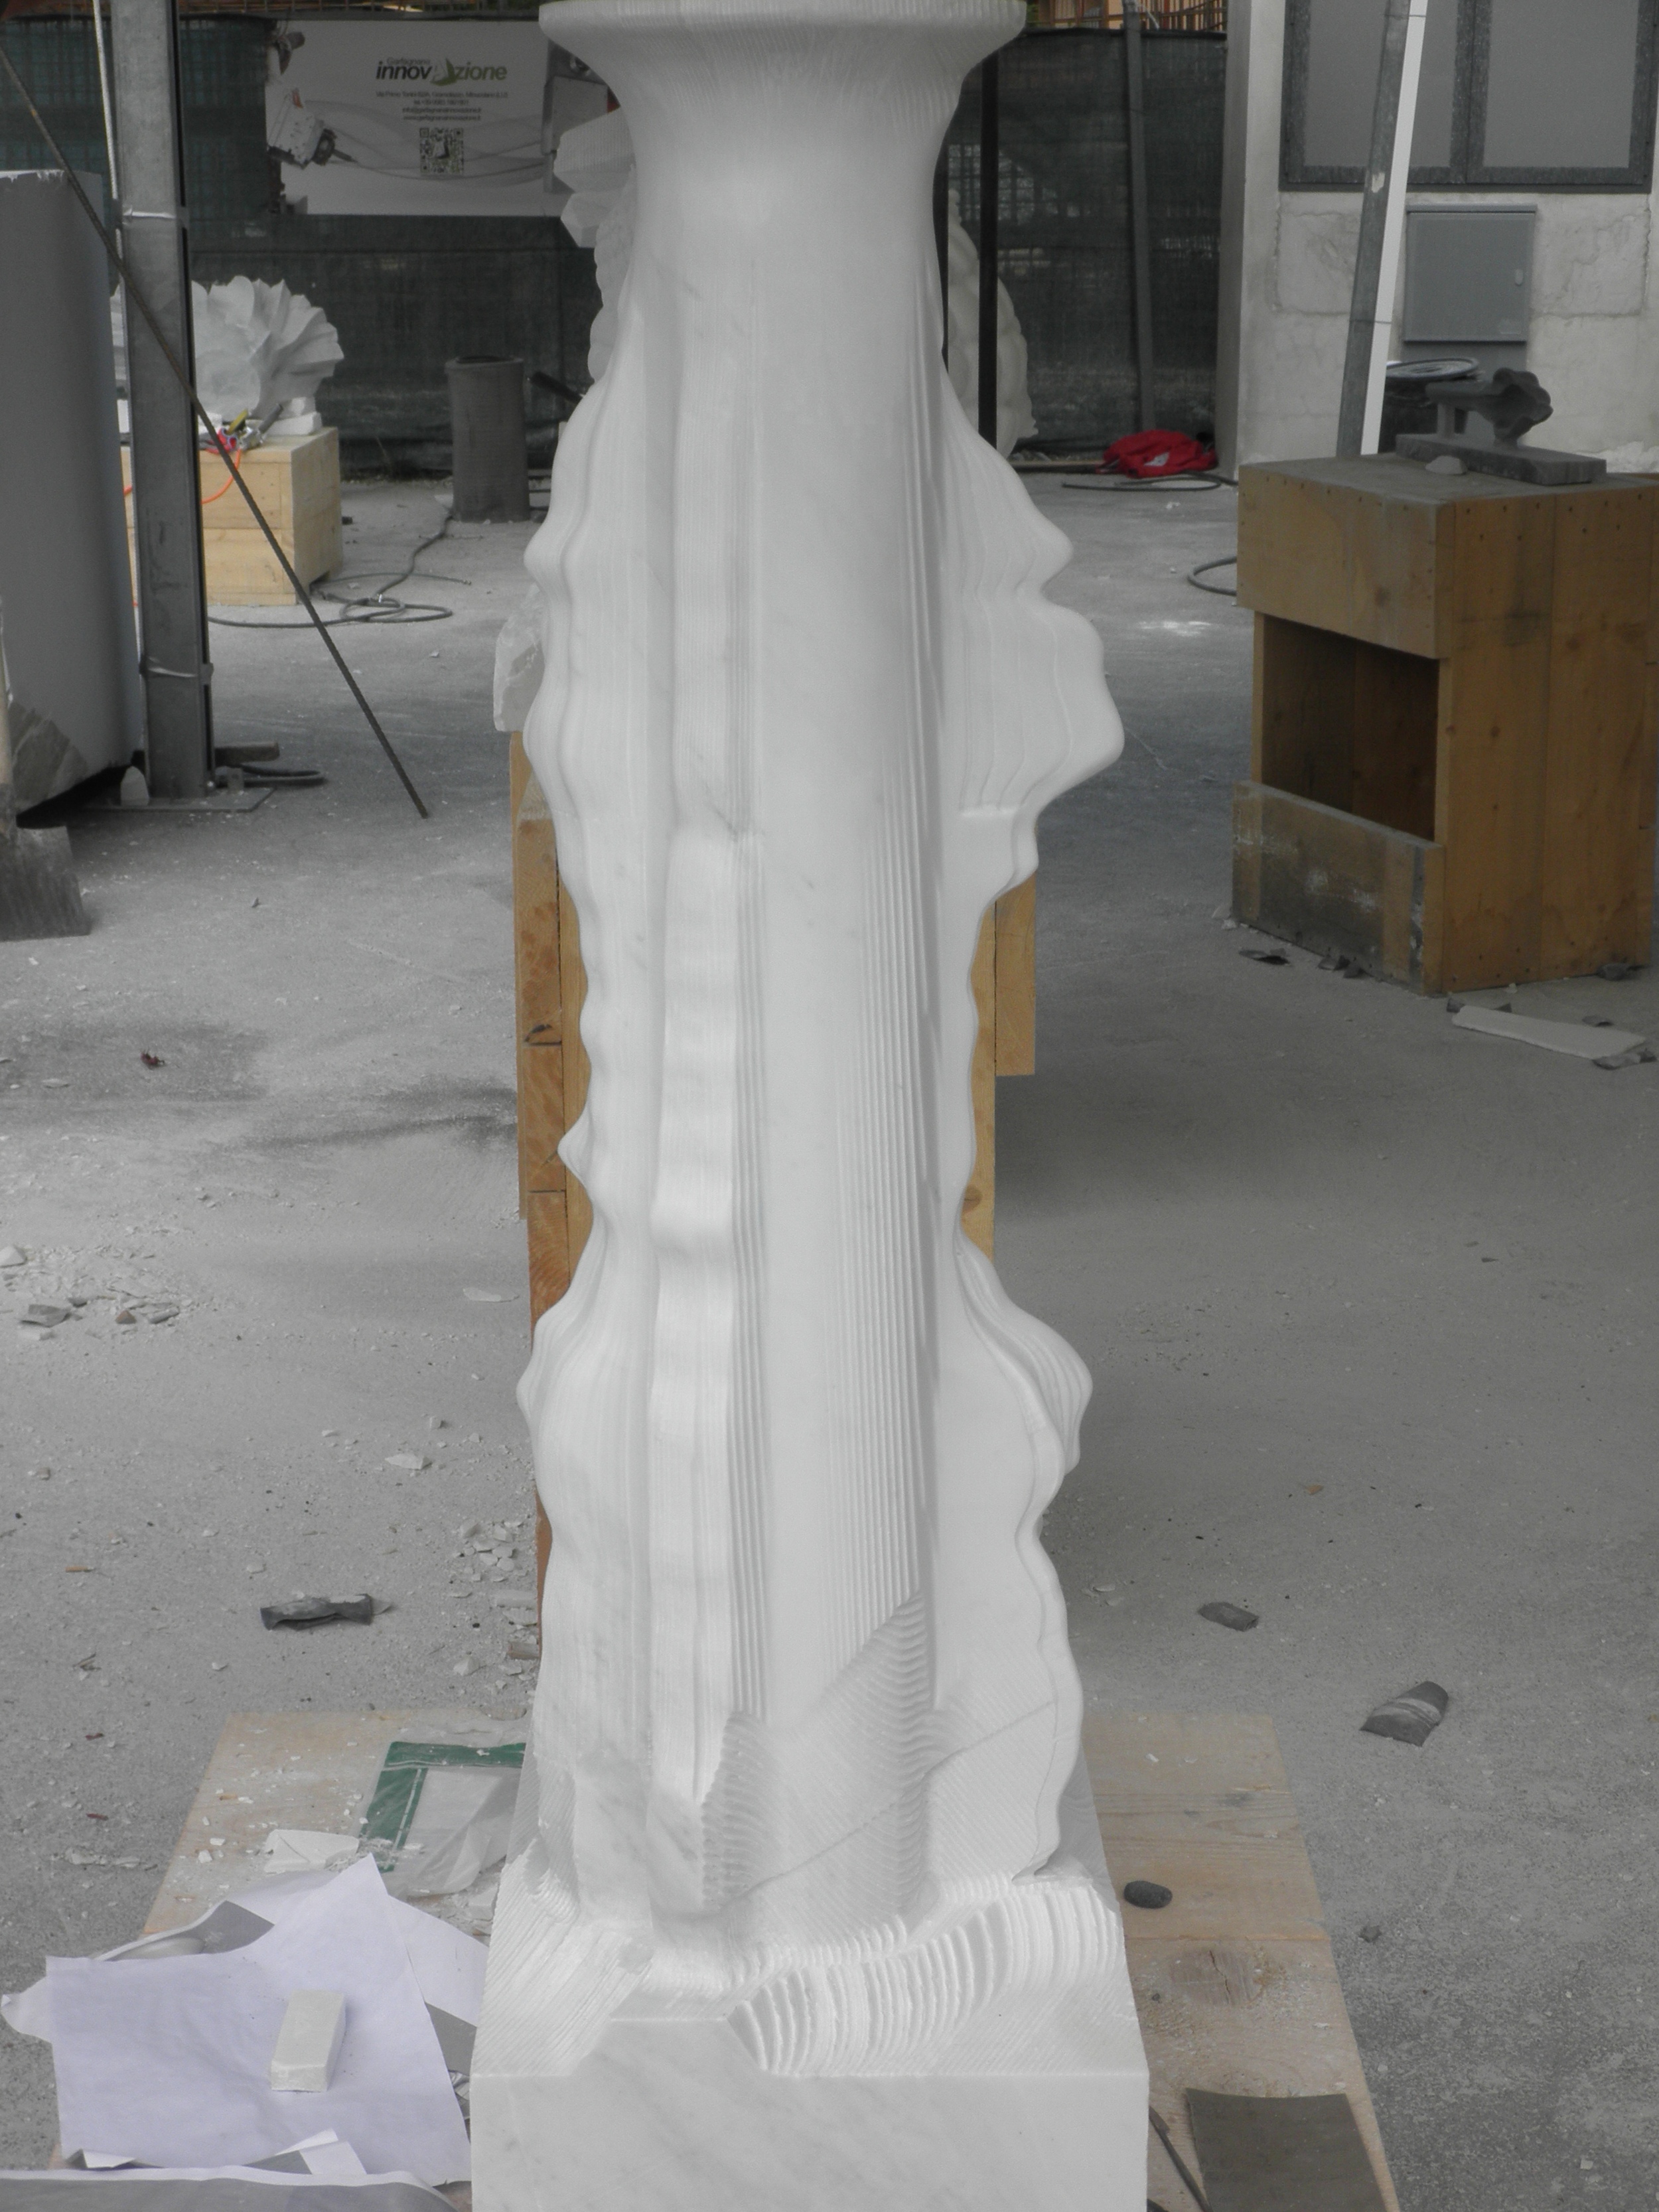
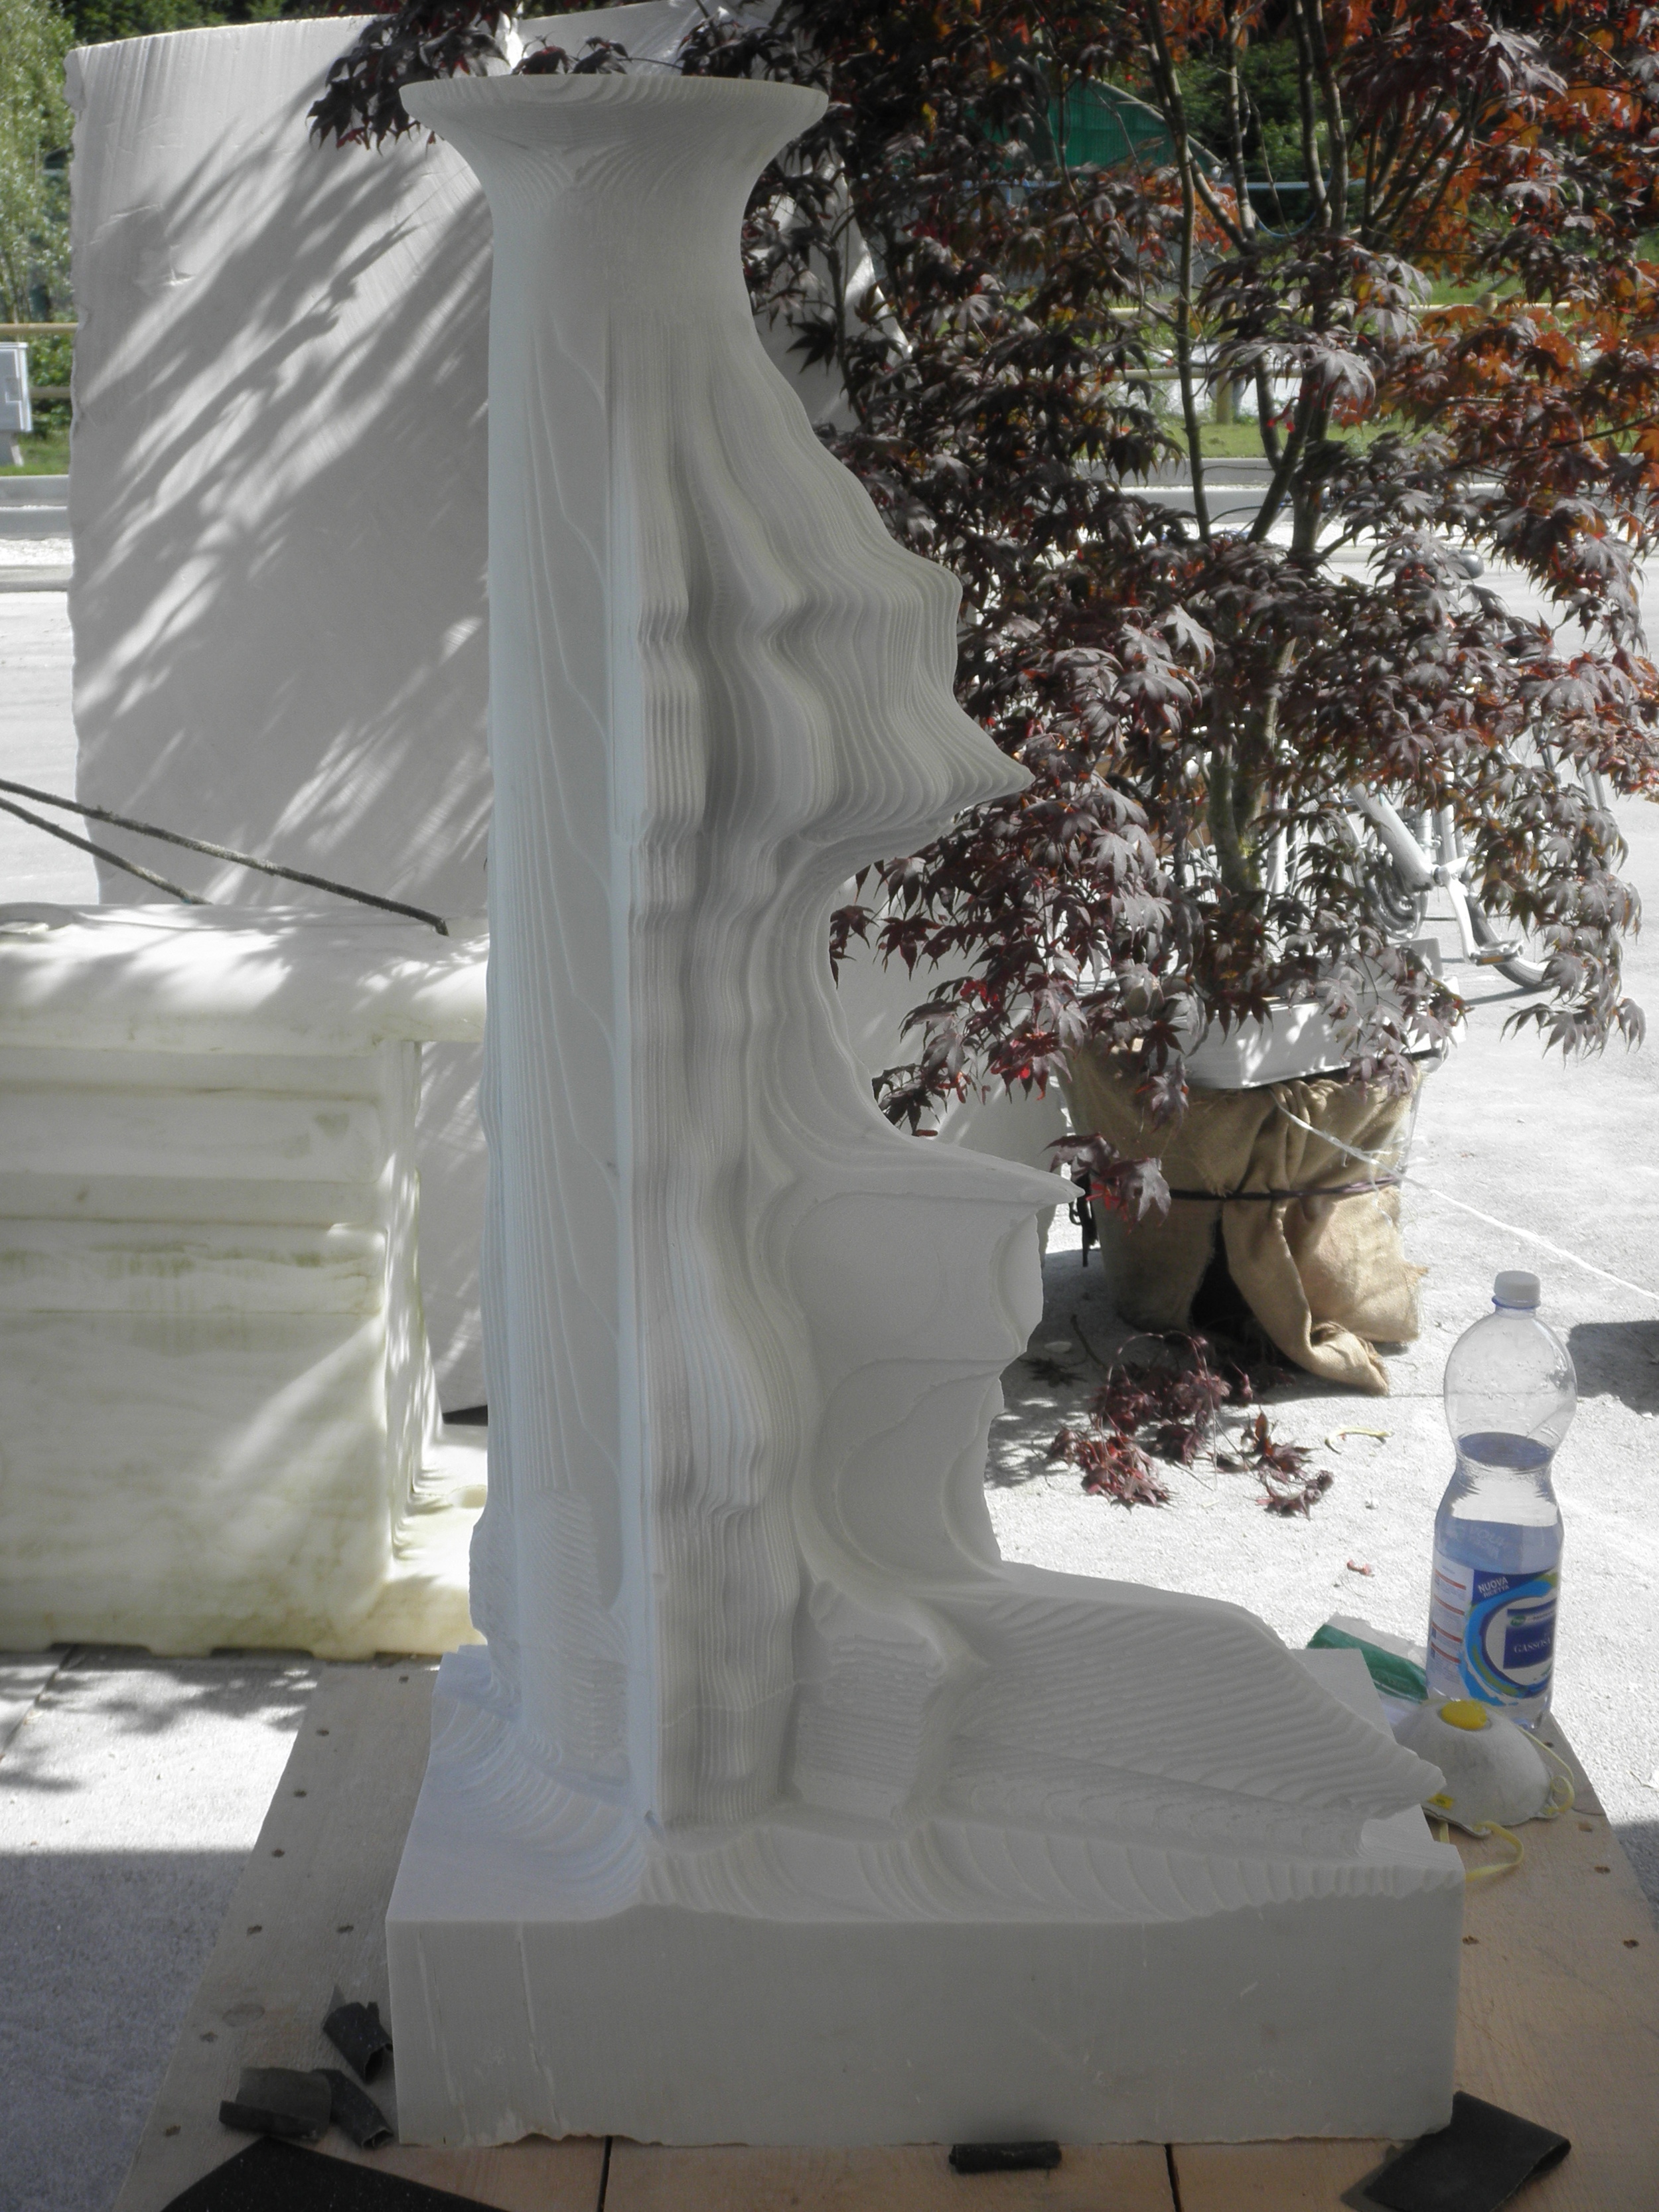
In 2013, my junior year at Bennington College, I was invited, by Jon Isherwood, my advisor, to participate in the Digital Stone Project at the Polo Tecnologico Garfagnana Innovazione, Tuscany, Italy. I was one of thirteen participants from the United States. This month-long Digital Sculpture Training workshop required us to produce a sculpture digitally, over a four-month period, and send the files to the Institute where the sculpture would be CNC’ed on a 5-axis or 7-axis machine and be ready for us to finish when we arrived at Garfagnana for our month-long session.
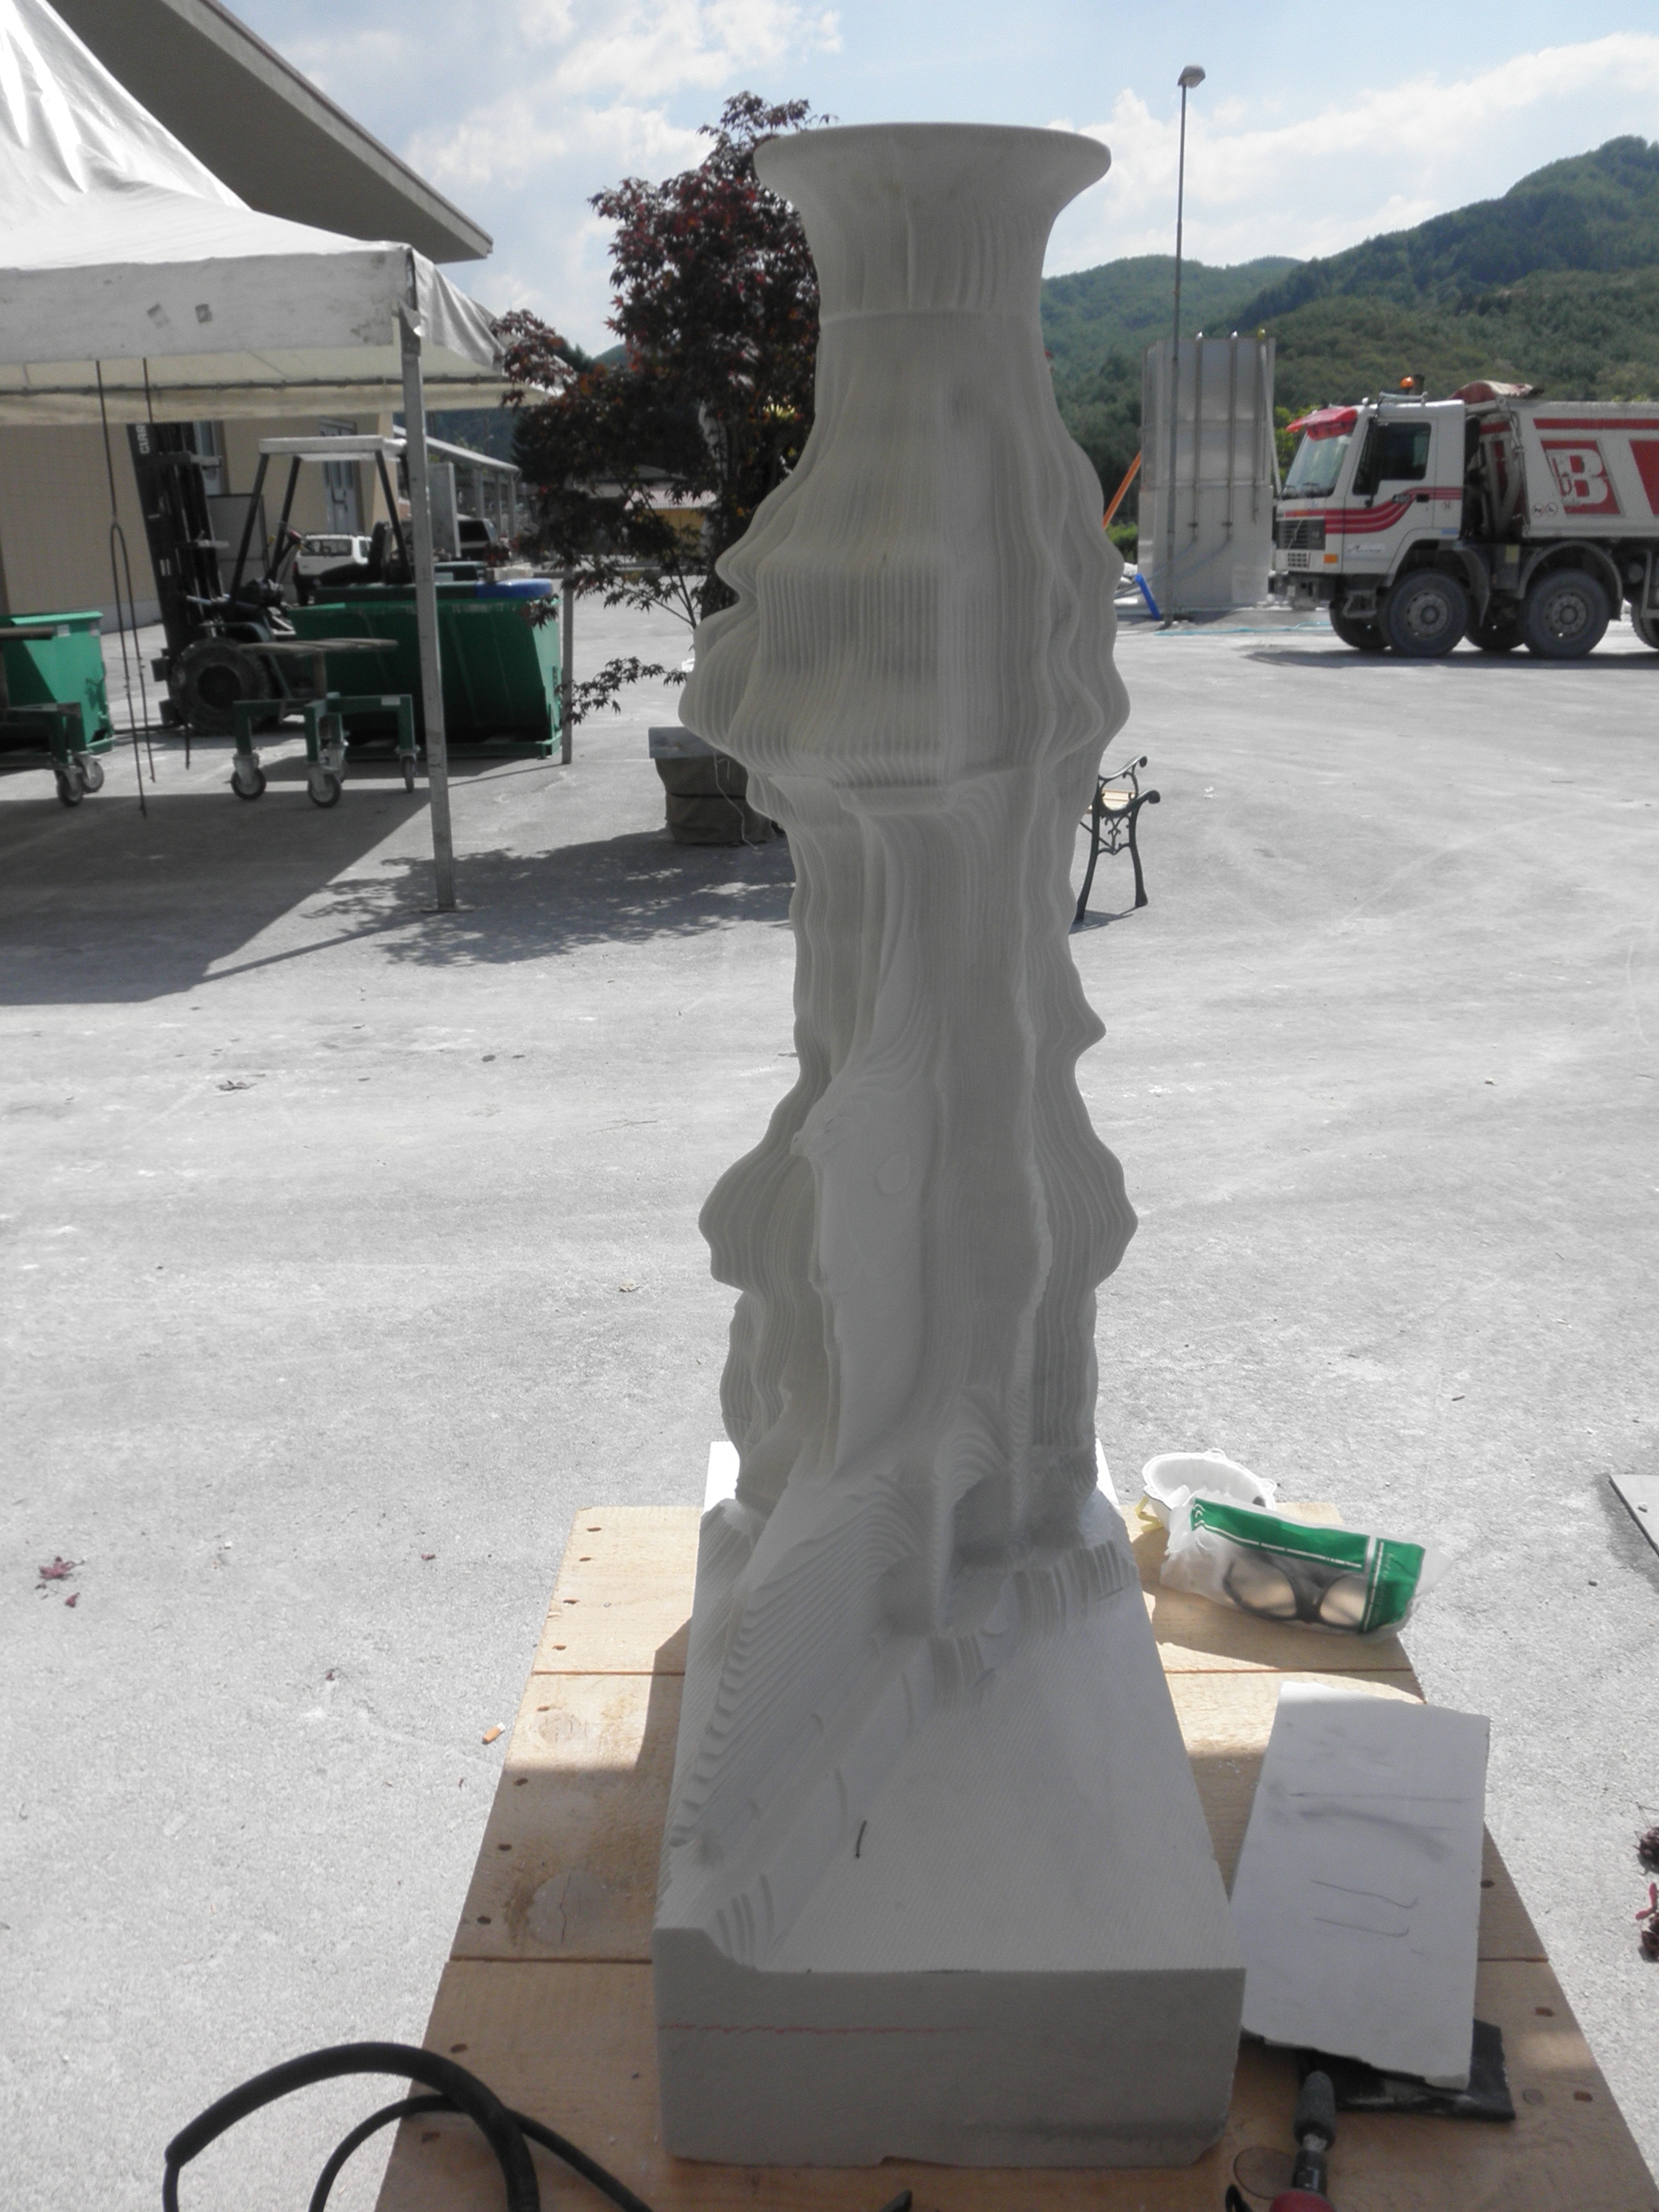
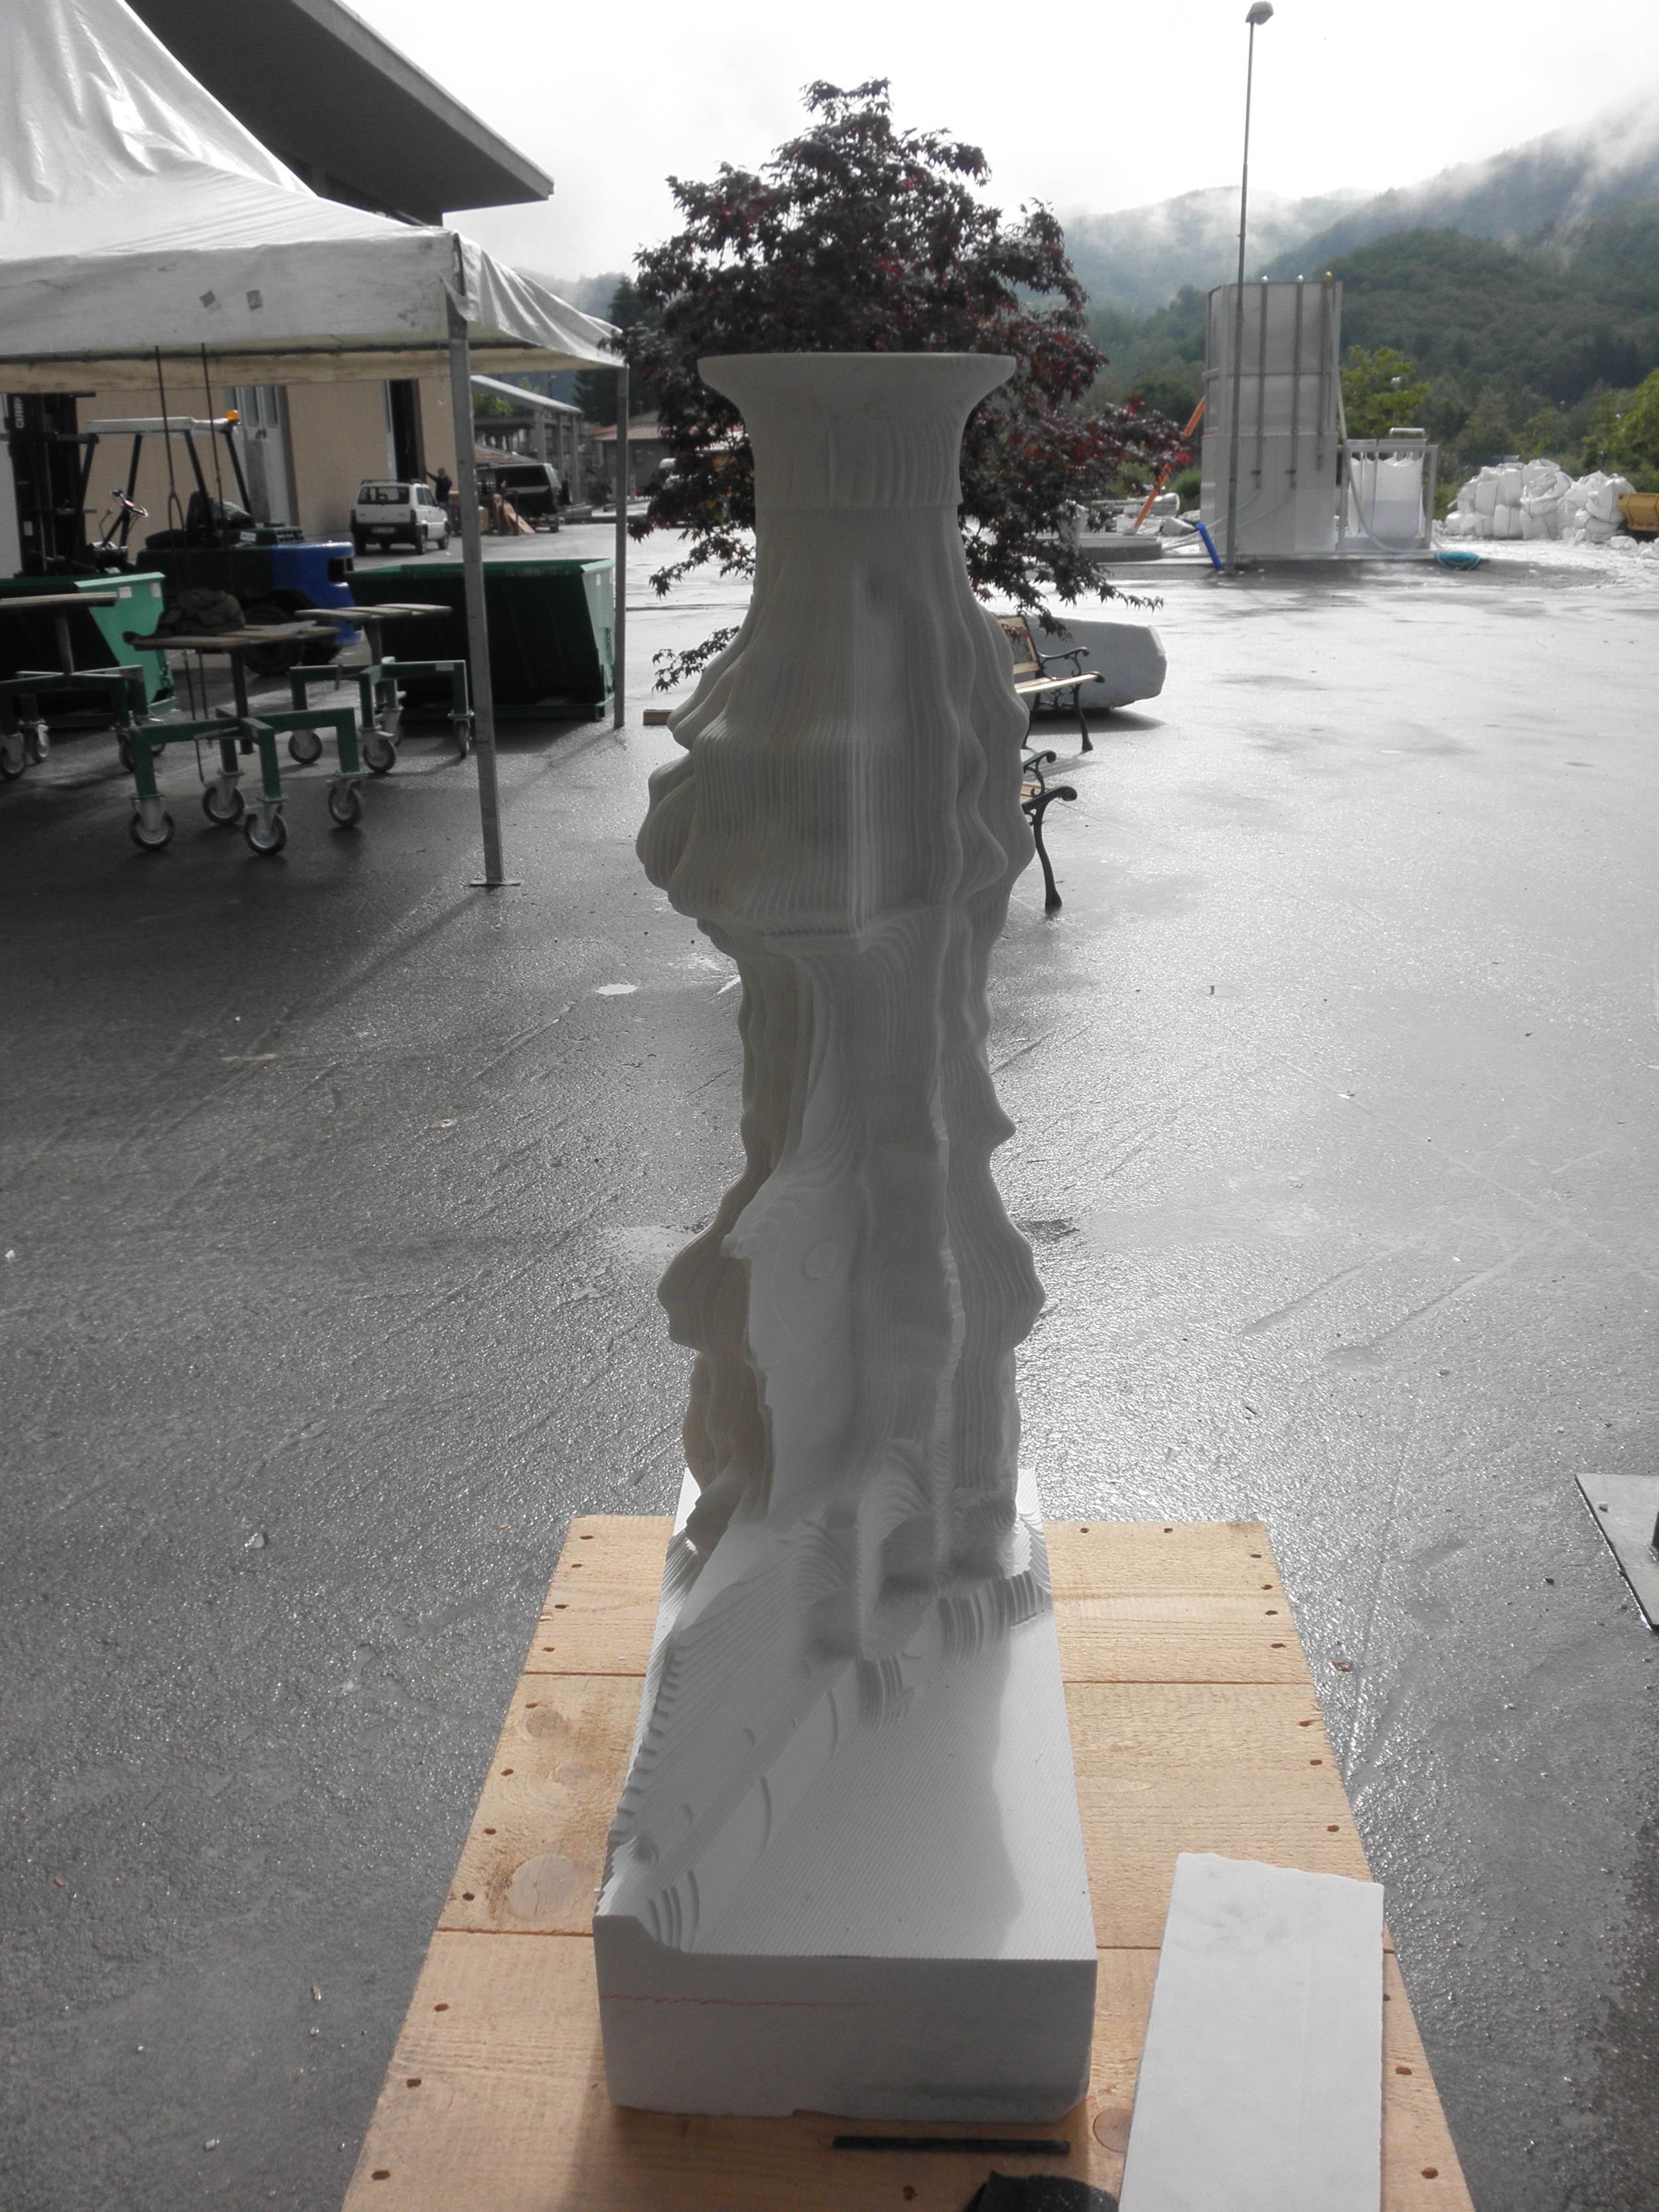
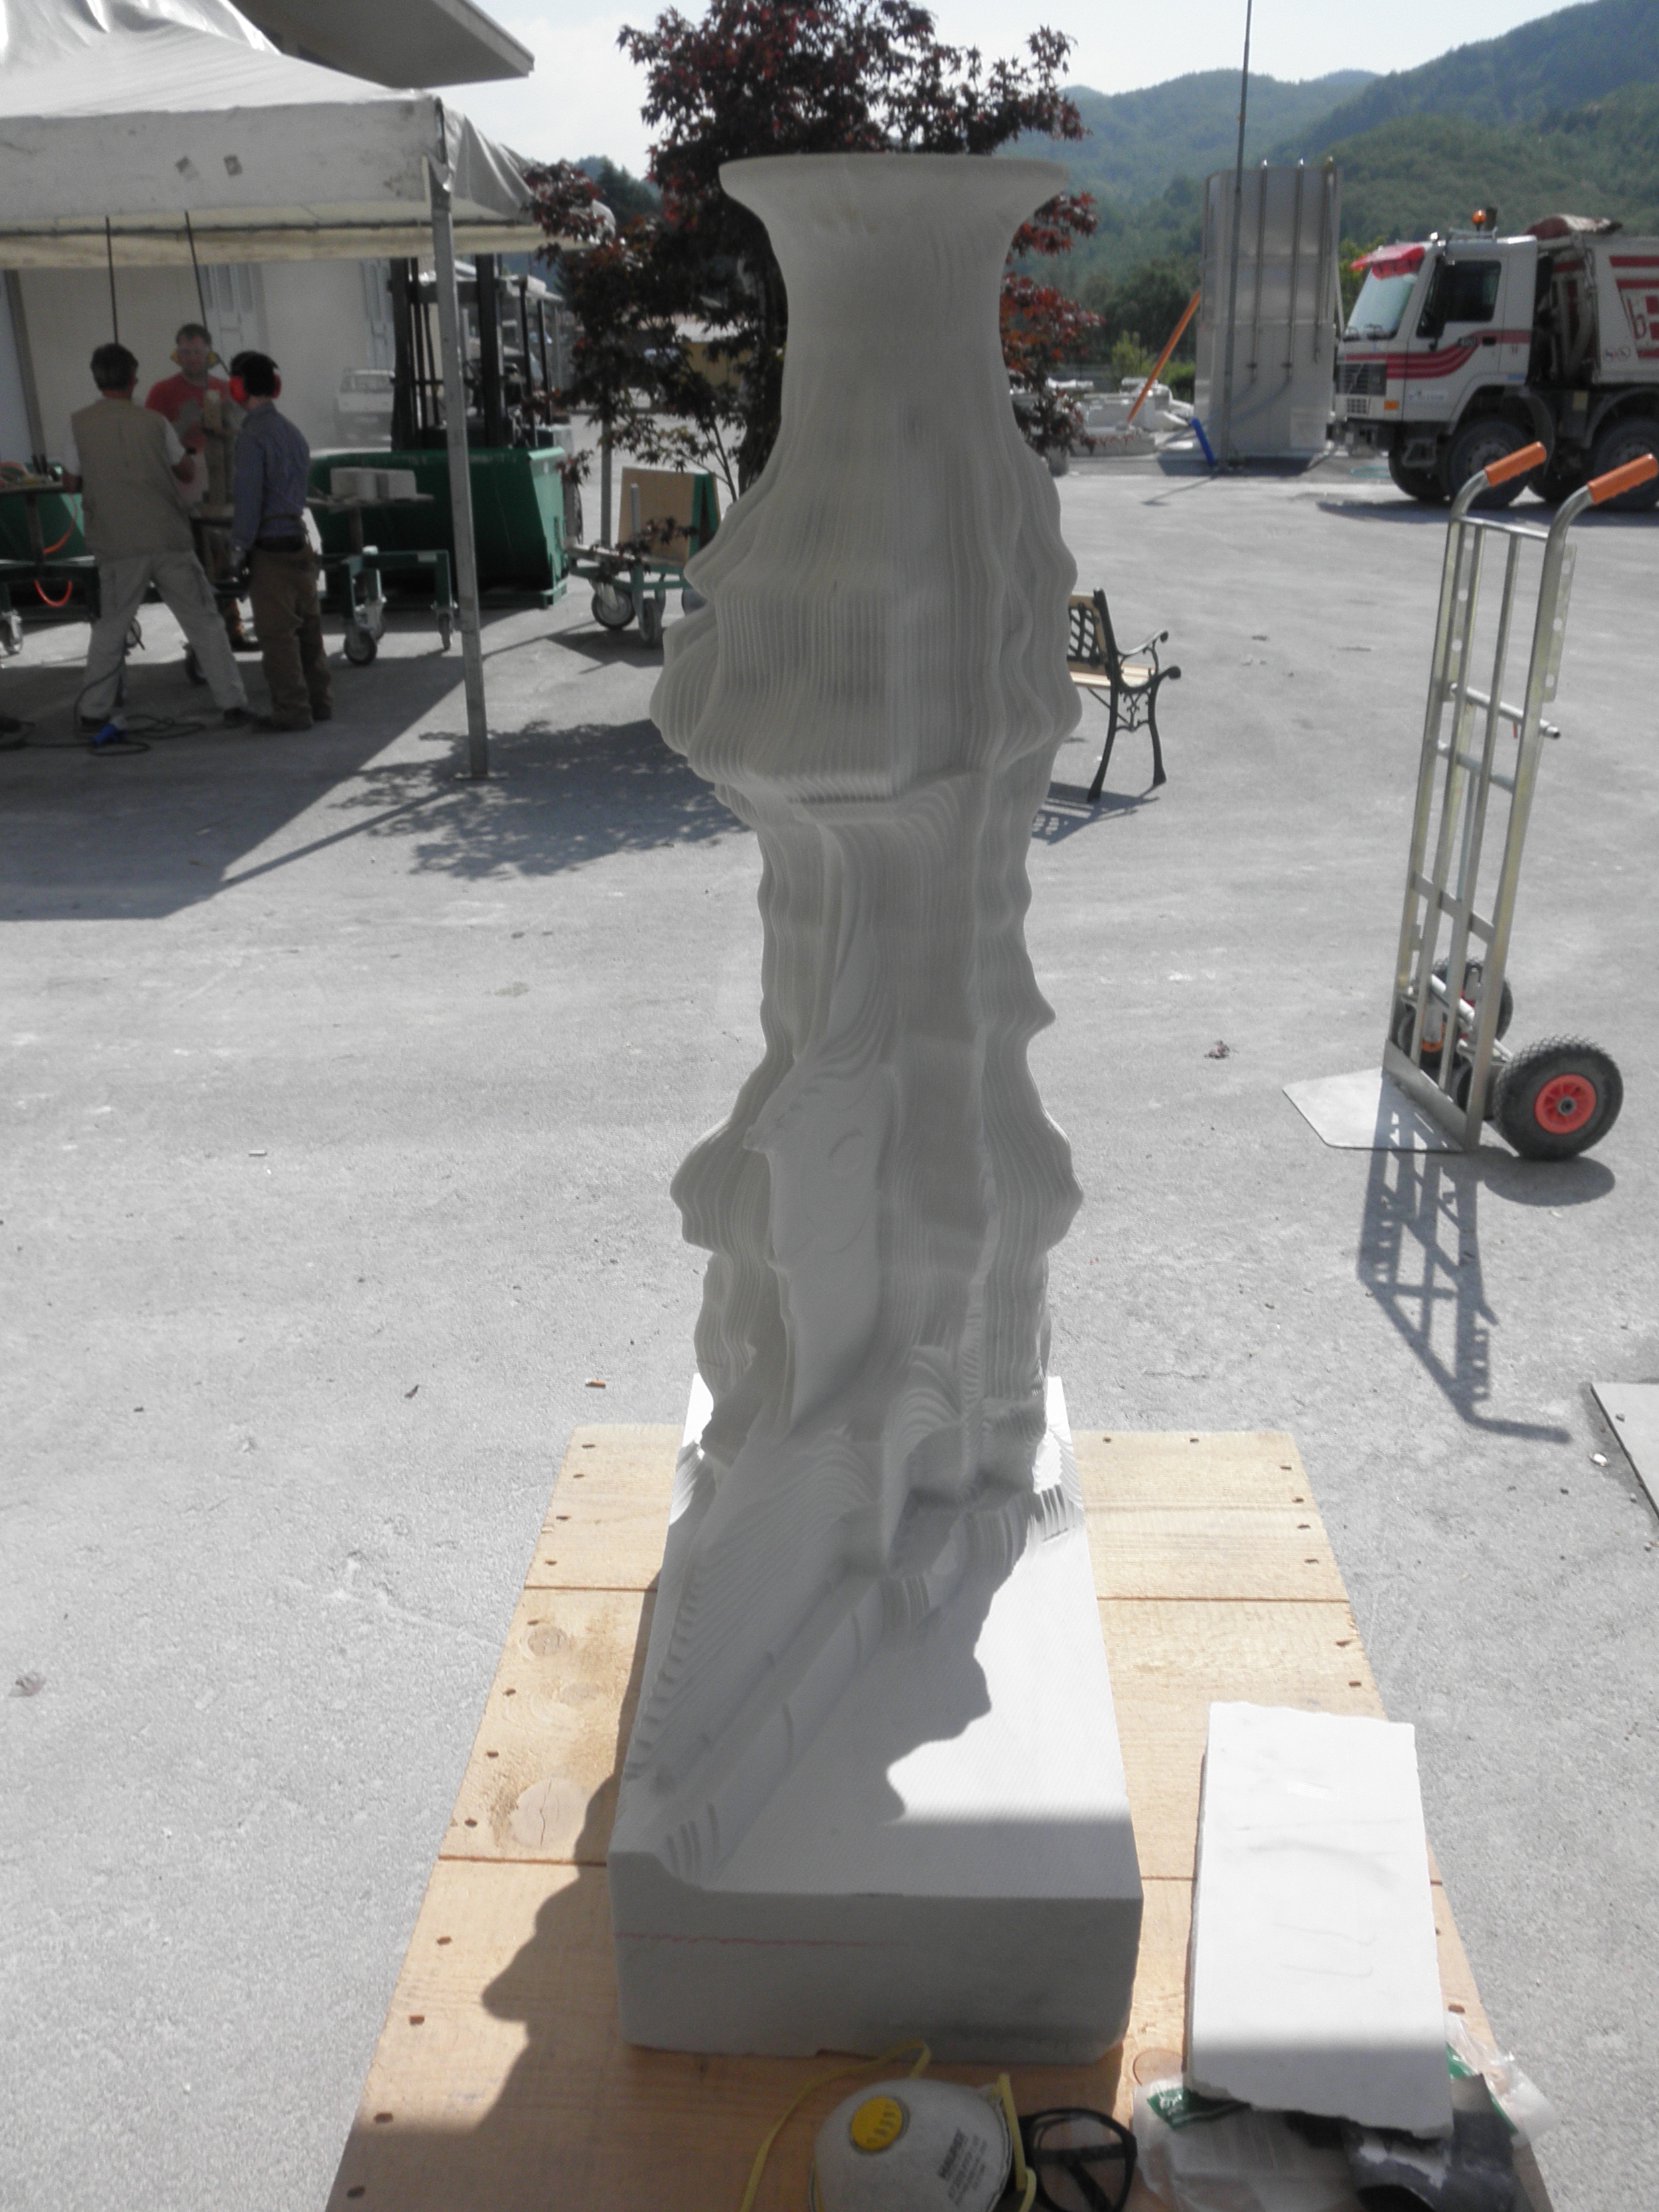
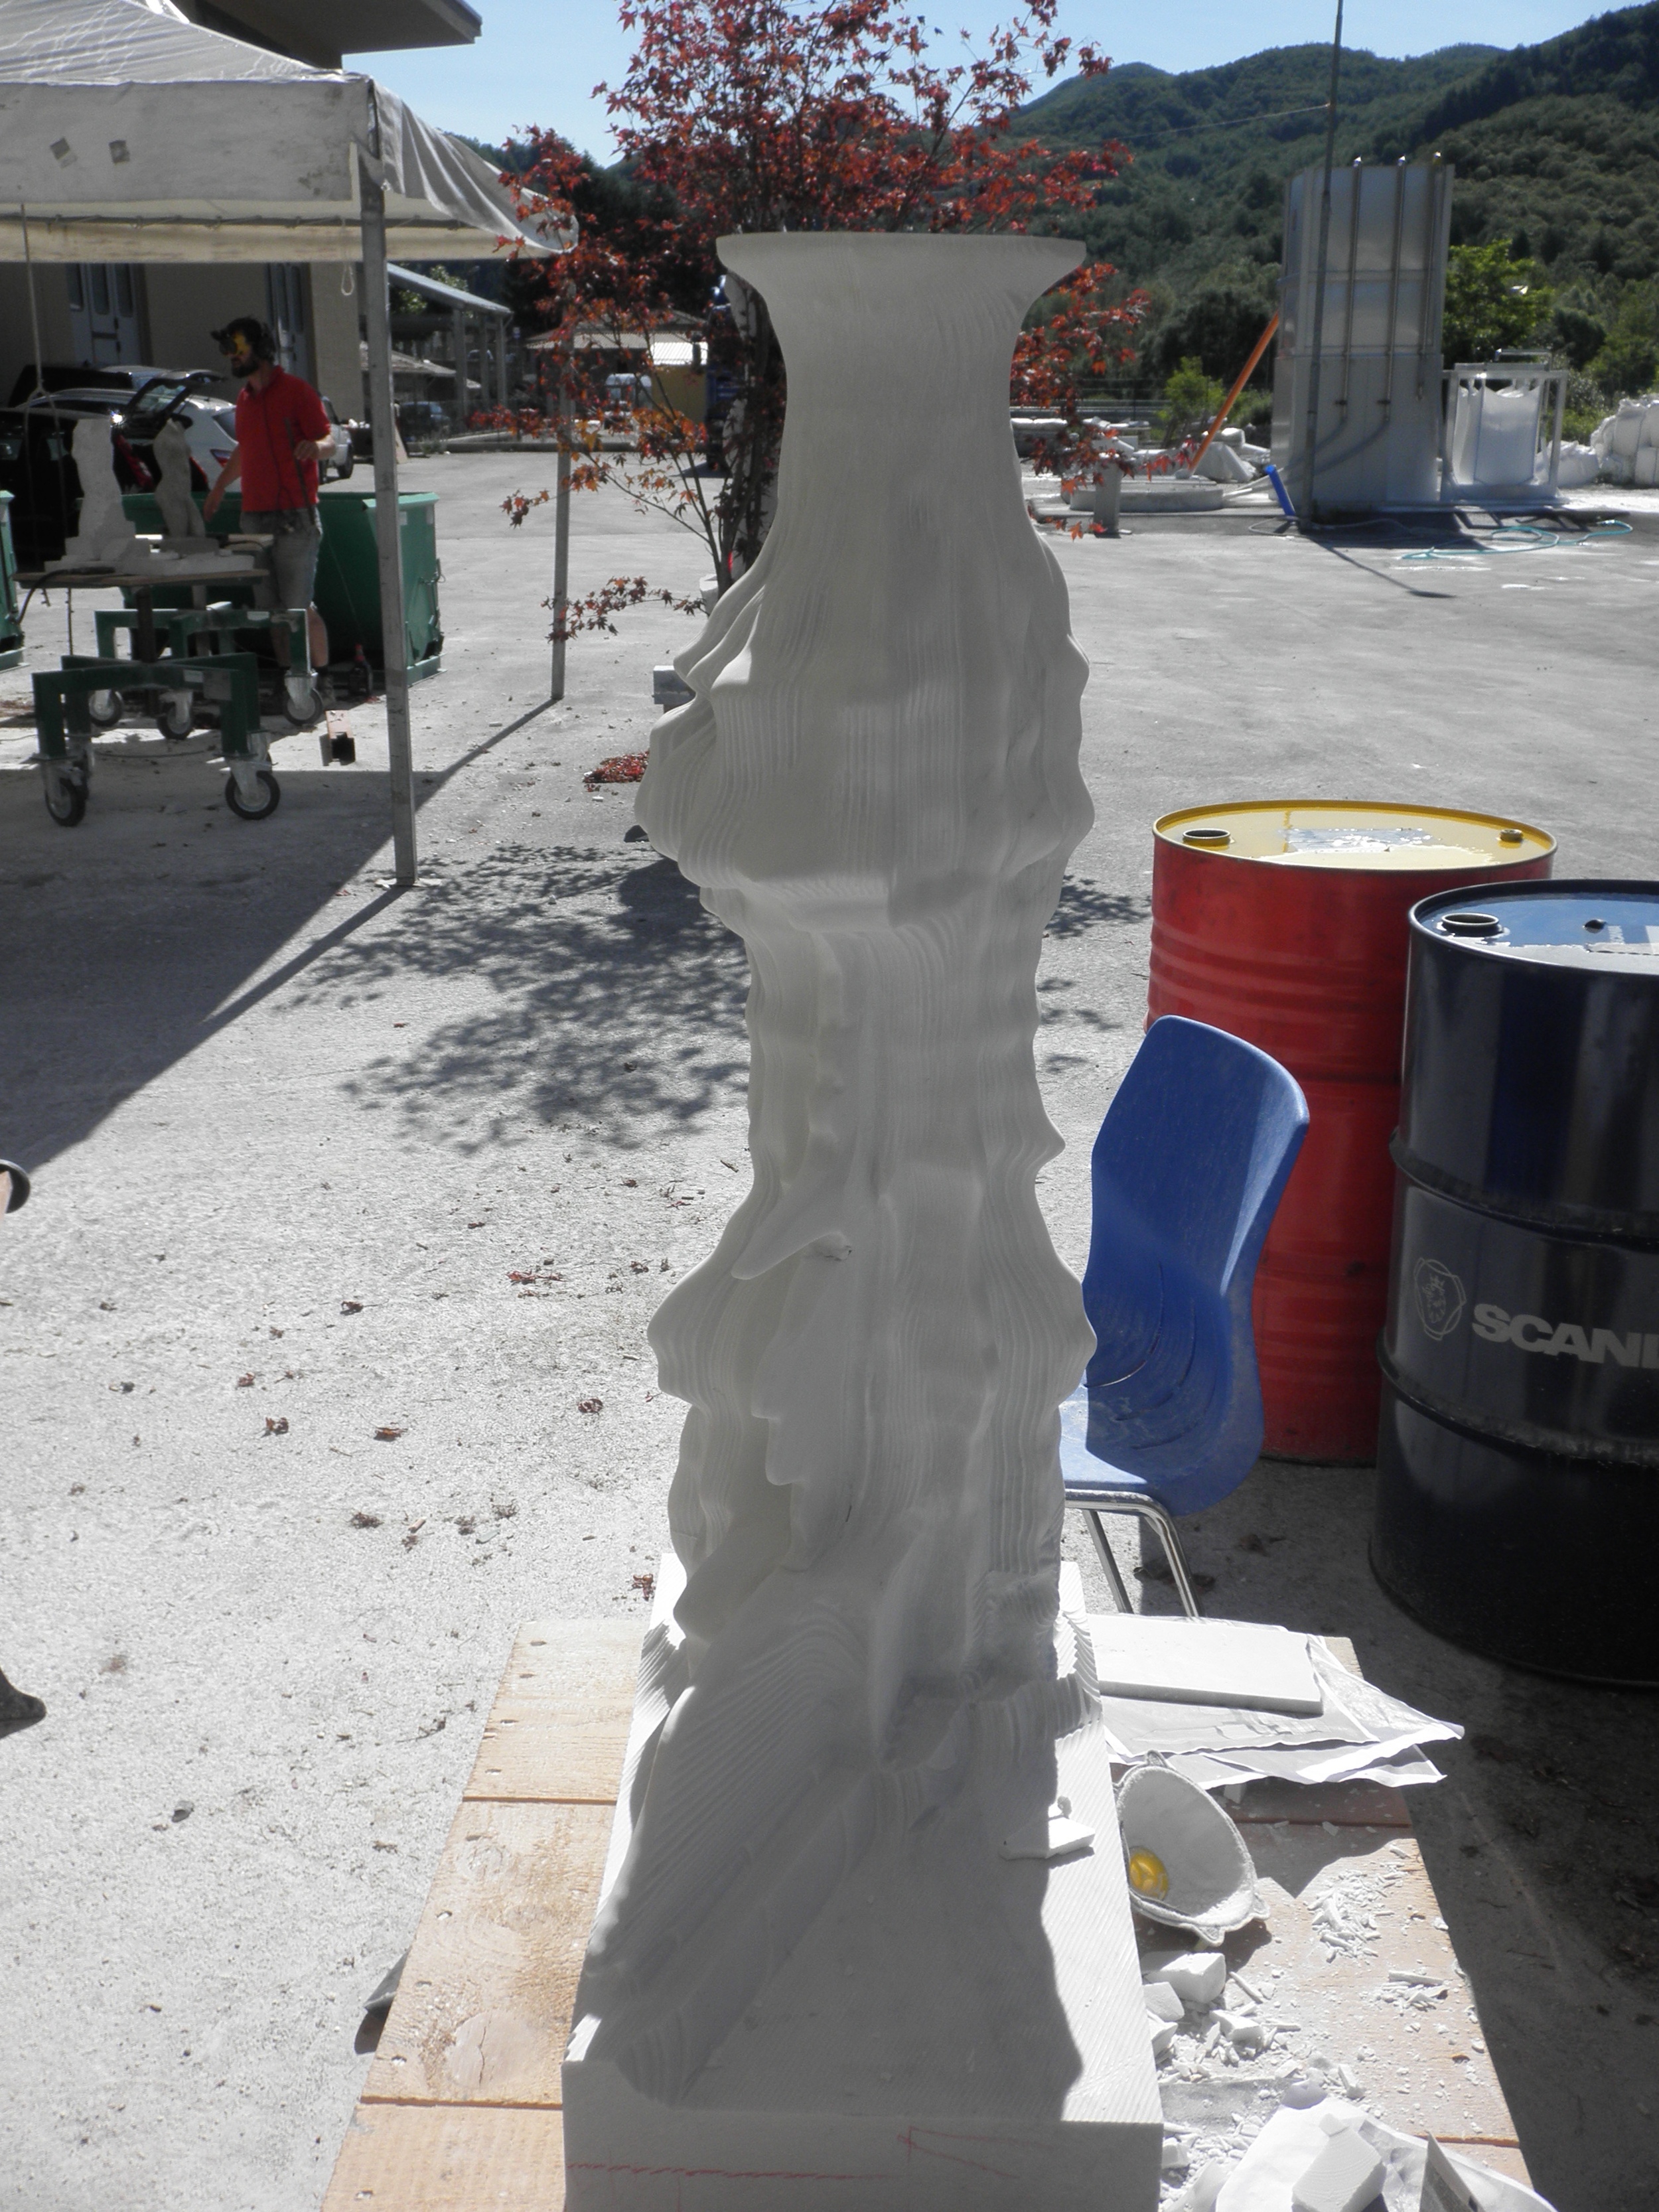
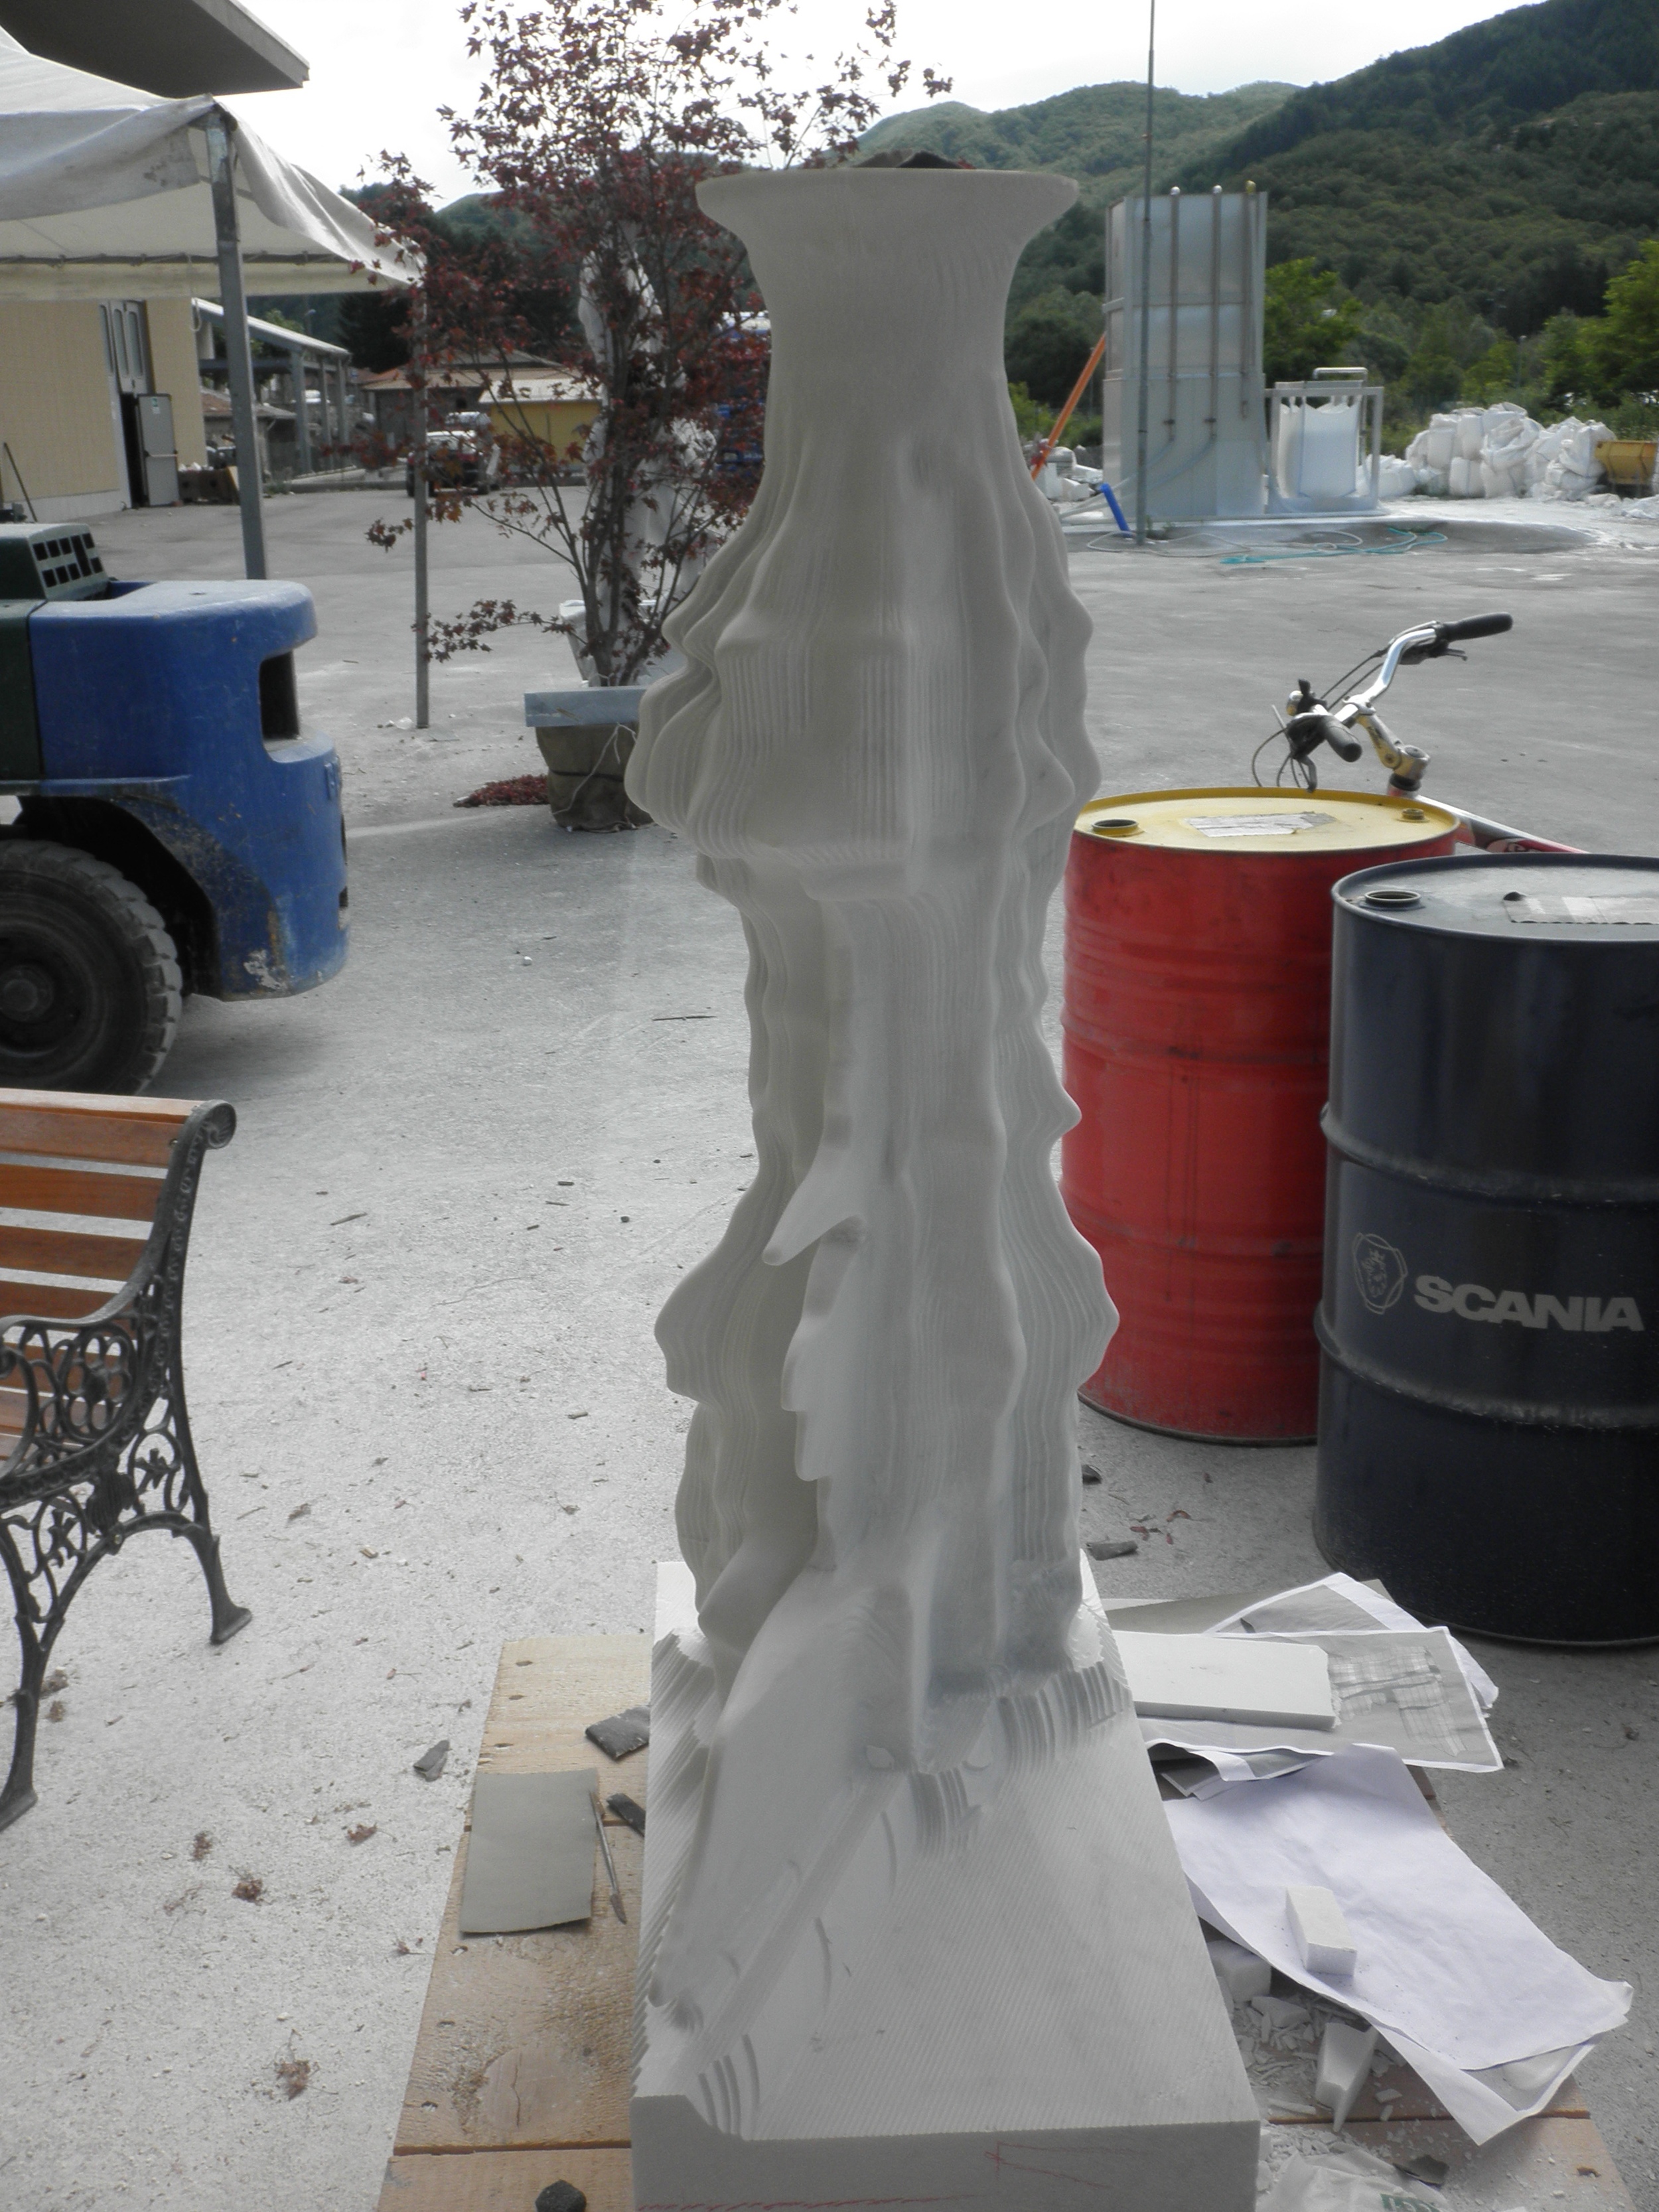
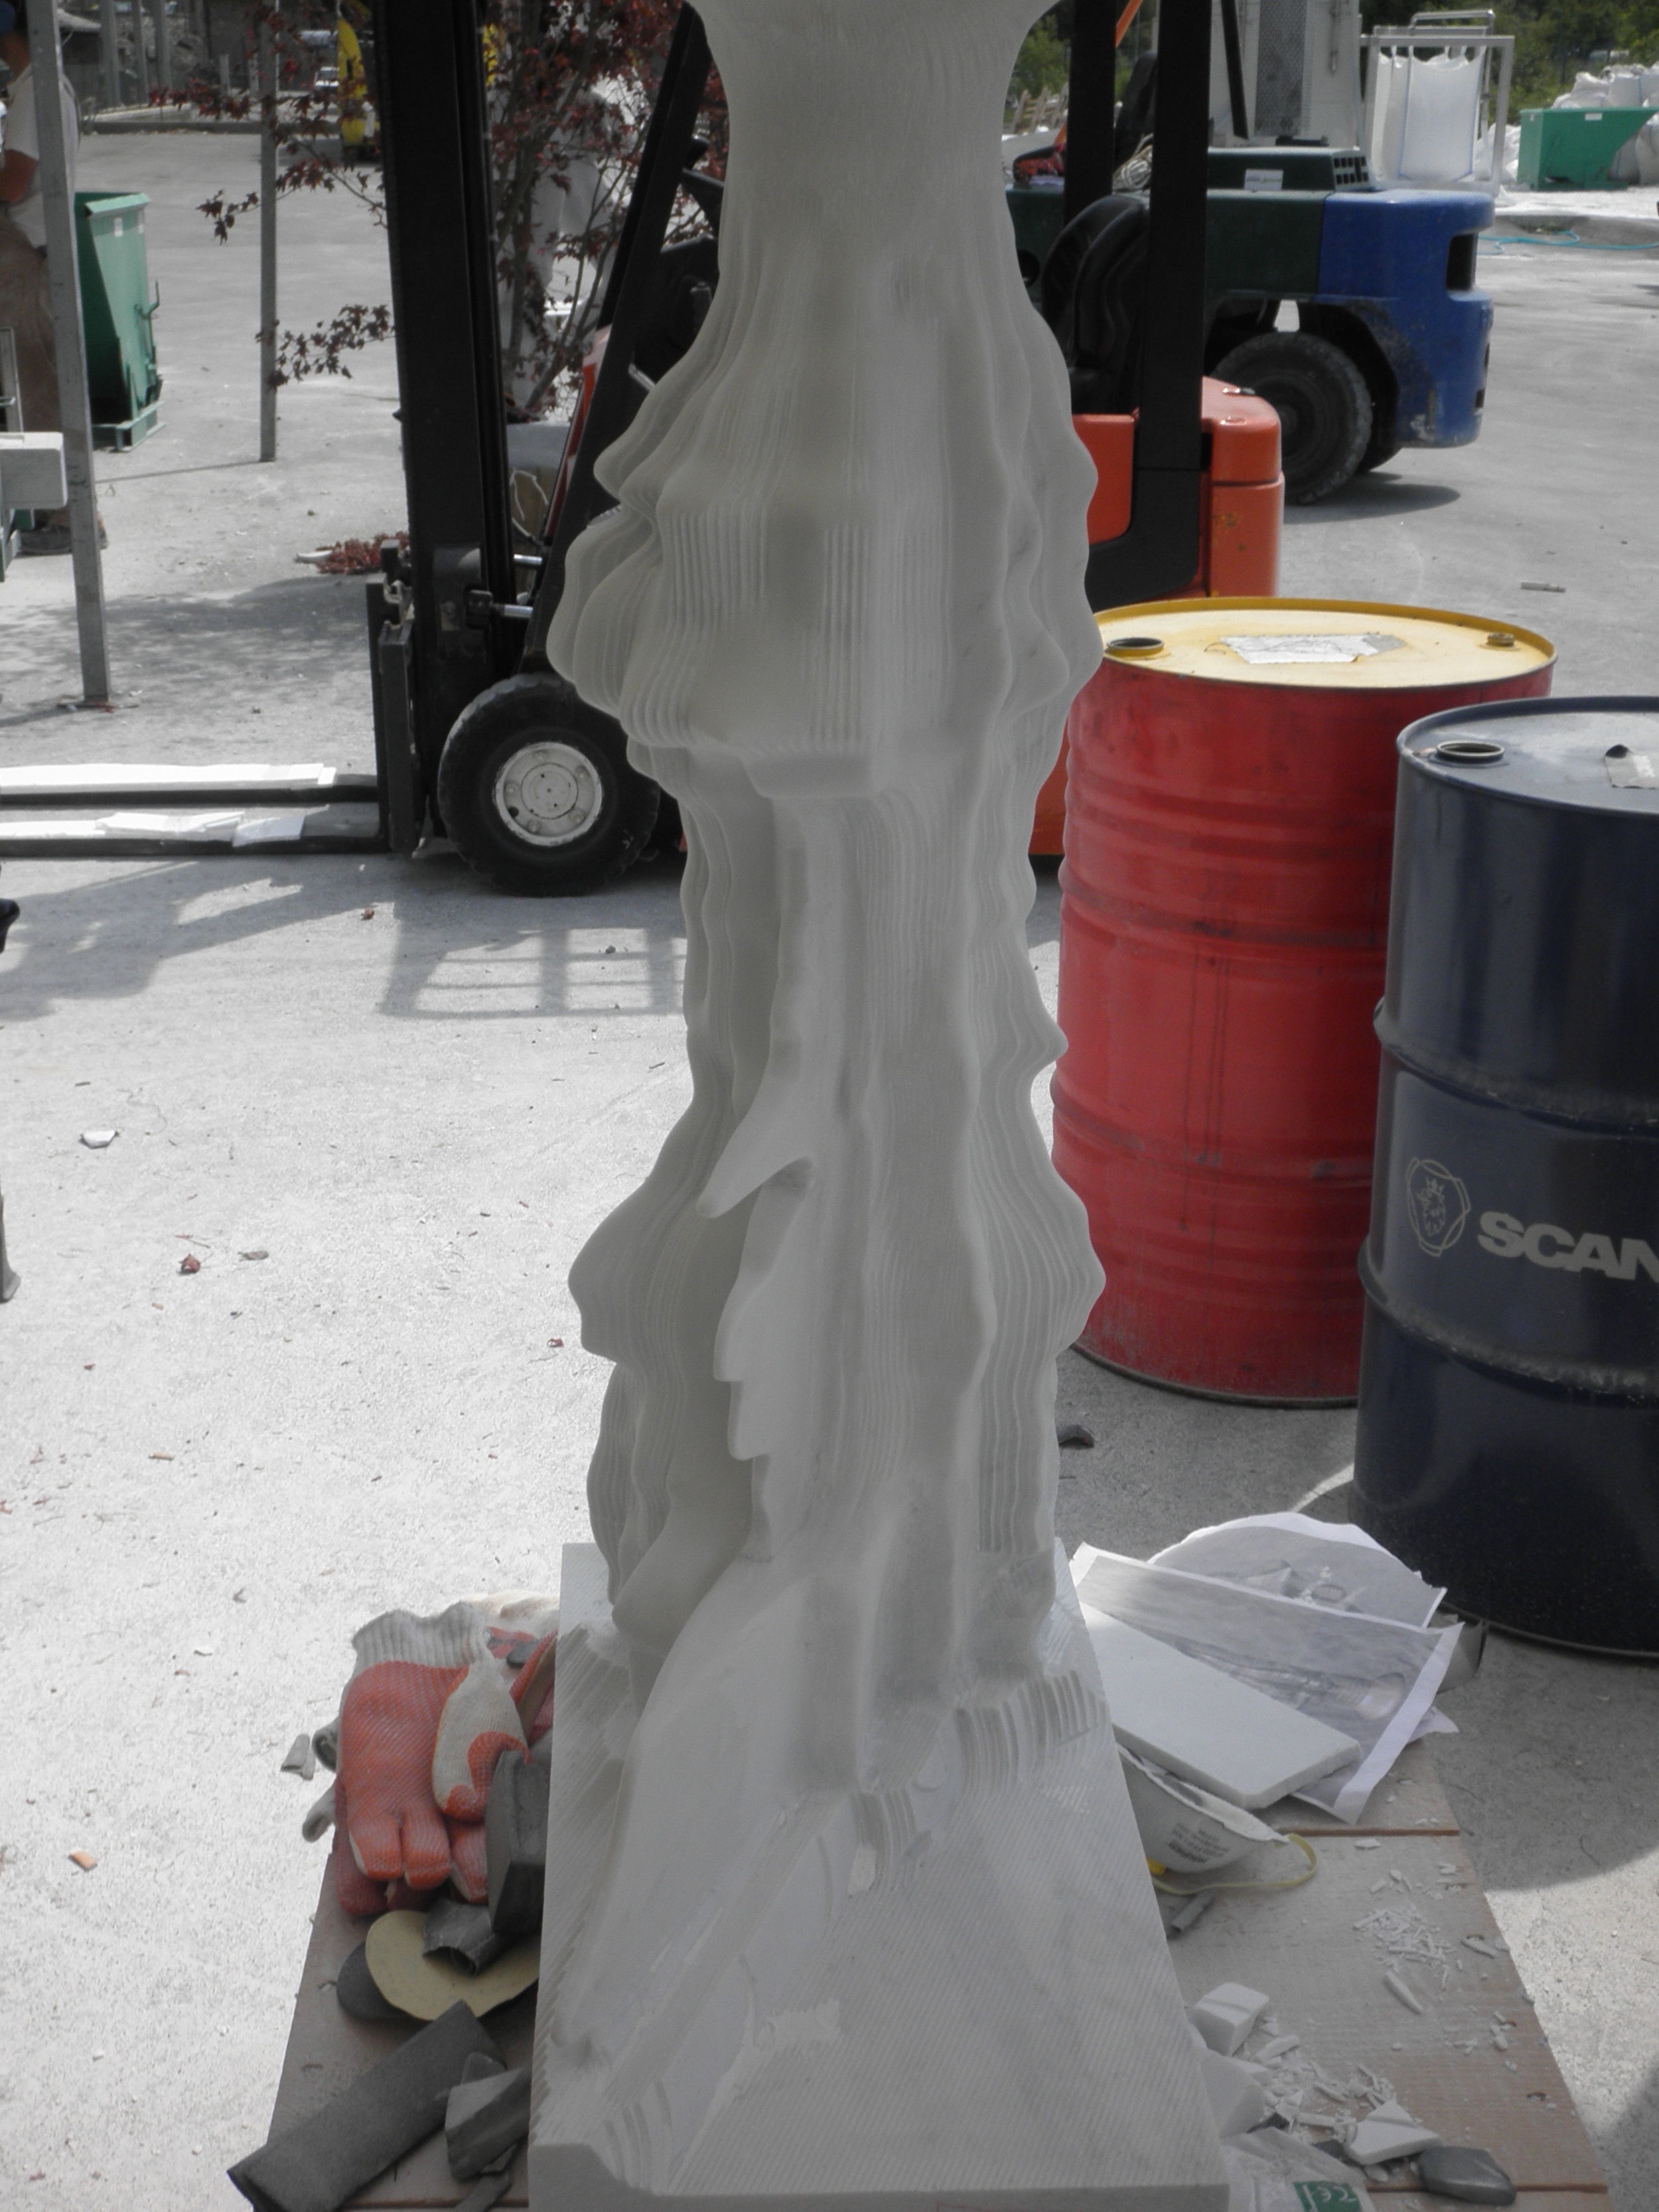
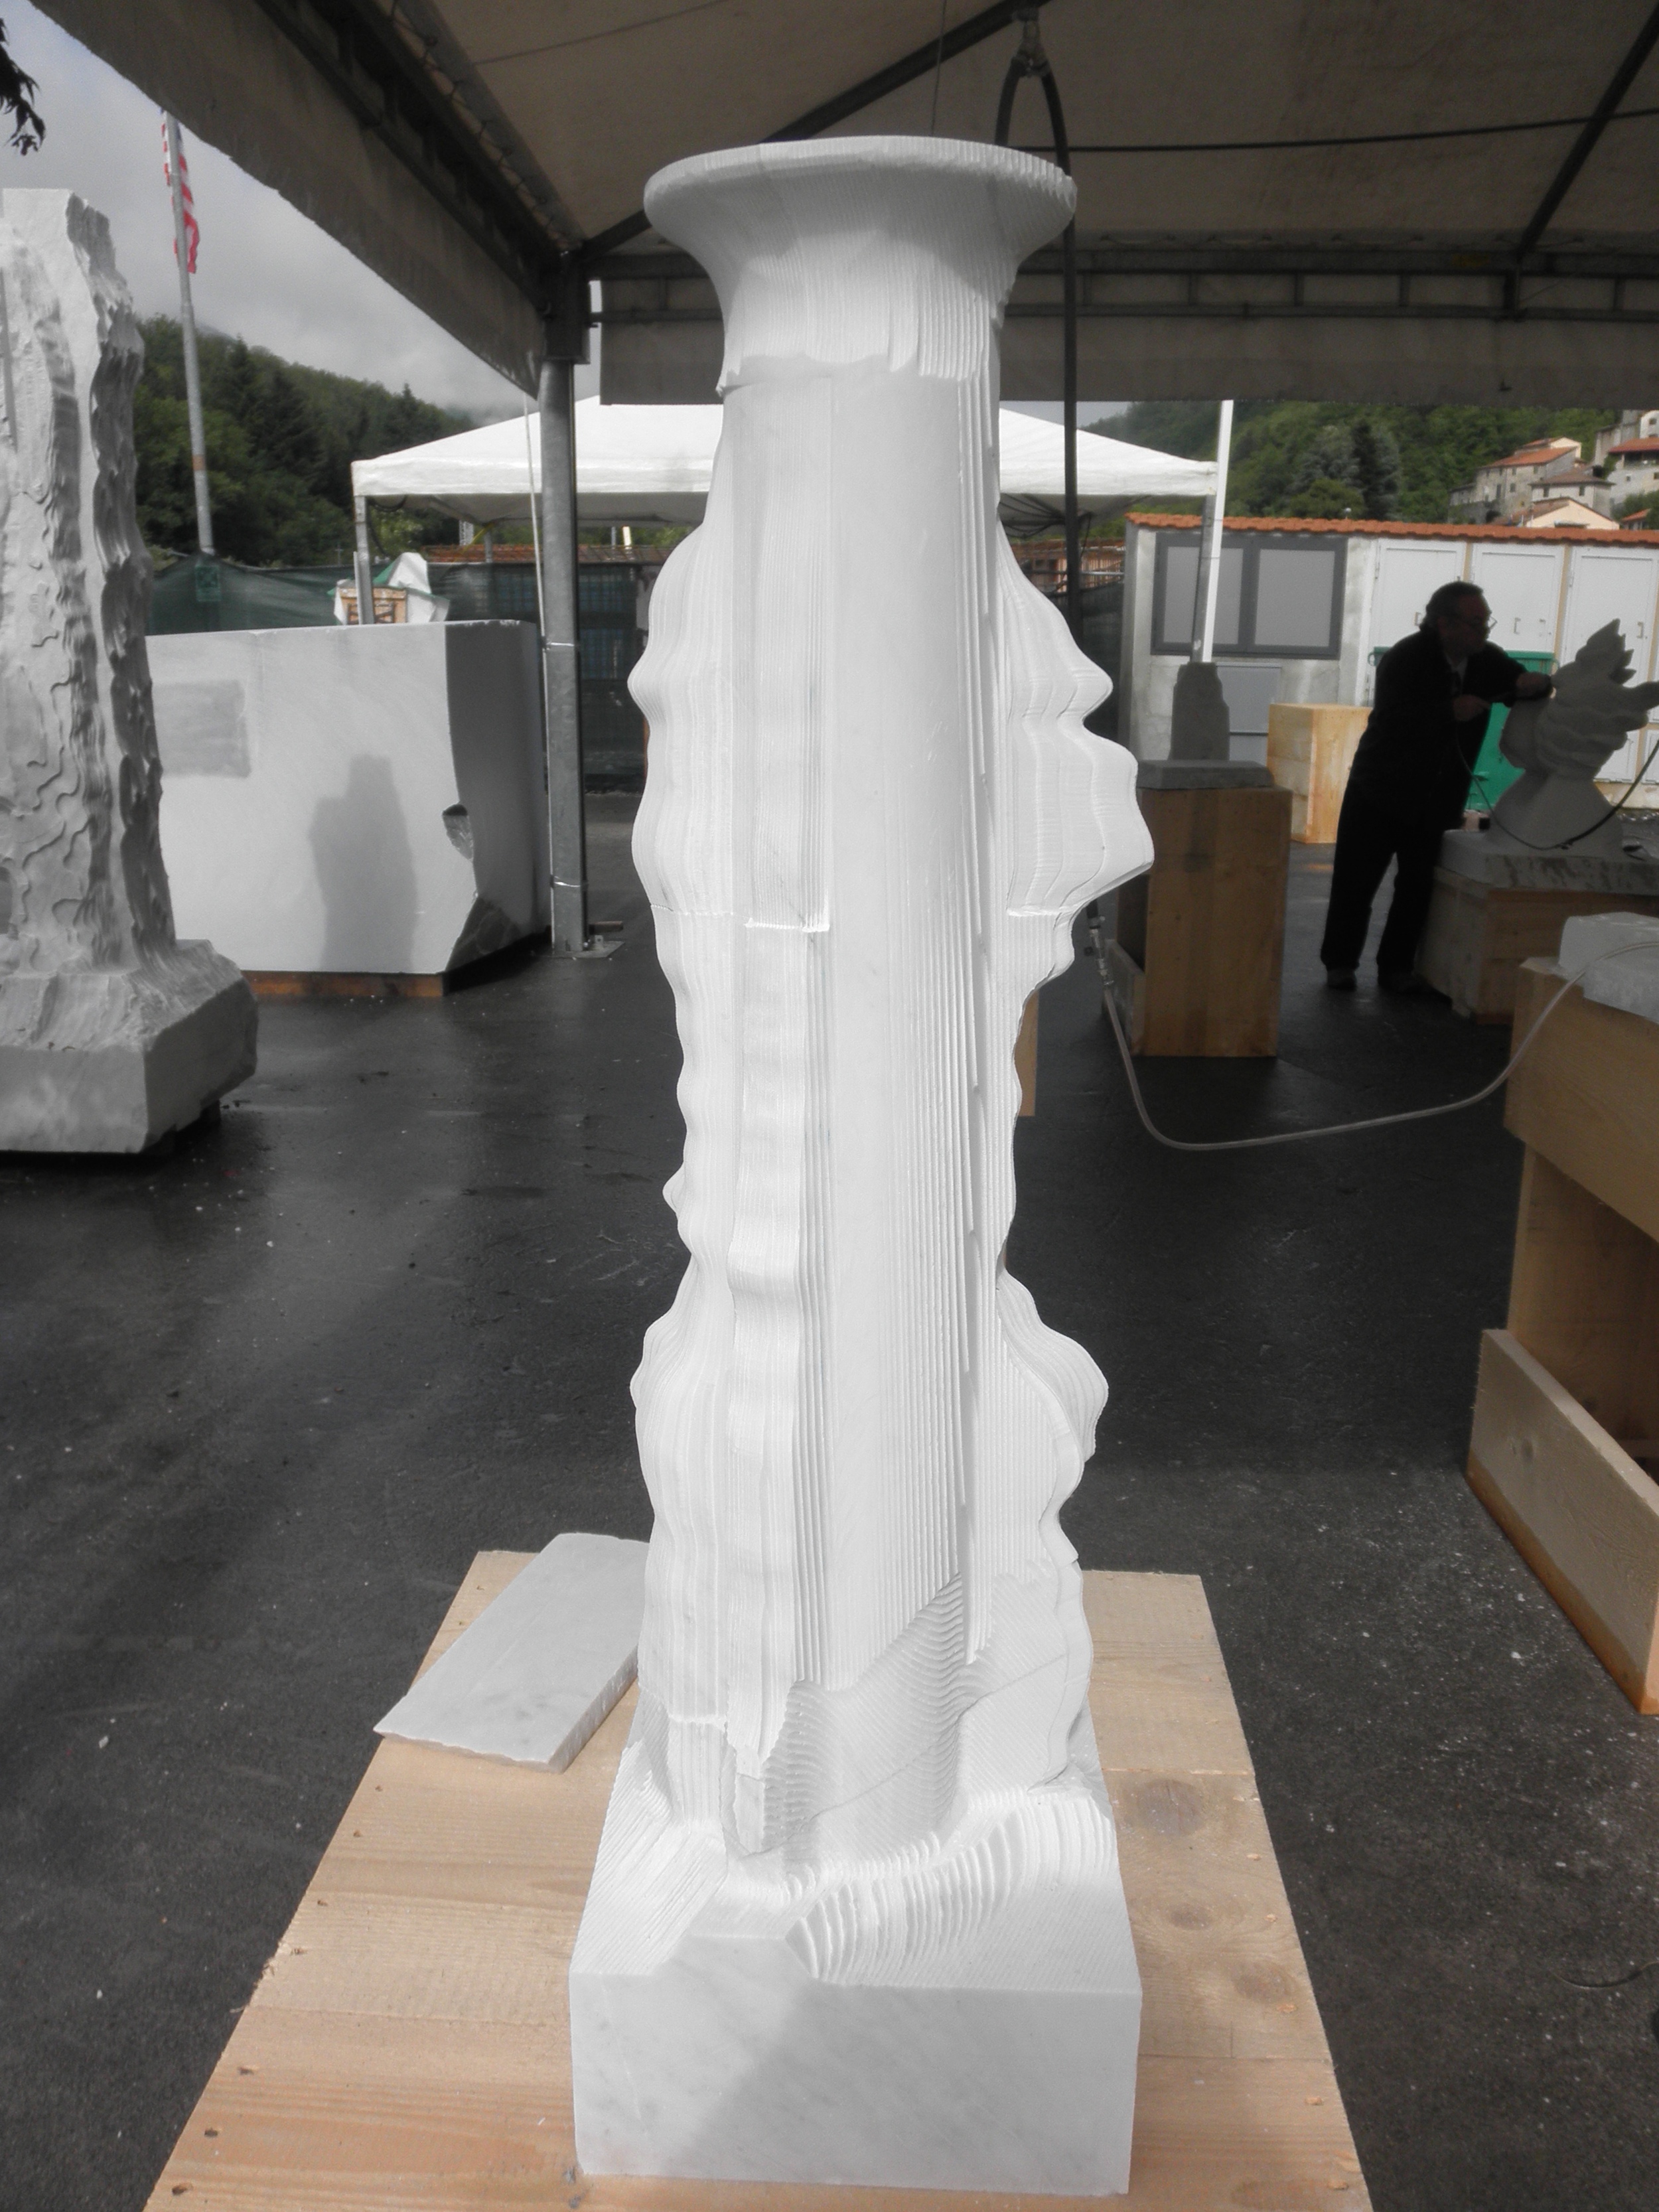
The sculpture I created is a visualization of juvenile drug arrest data in the United States from 1964 though 2009. The sculpture was on display in Italy until the end of 2014 and subsequently on display at William Paterson University to the end of May 2015.


In the reports, the population of the country was first divided into two major subsets: Male/Female and White/Black. The Total Number of Arrests had a distinct subset – Total Number of Juvenile Arrests. Both of these categories had a component called Number of Drug Abuse Arrests – Total and Juvenile.
Since I was interested in looking at Juvenile Drug Arrests, an analysis of the report categories gave five overlapping but distinct groupings that were critical to the visualization I was beginning to envision. First, it became possible to racially identify the juveniles arrested for drug abuse as - White, Black, or Other. Next it was possible to consider Juvenile Drug Arrests in Cities, Suburbs, and Rural Areas. This latter division broke up the juveniles into either - White or Black. Finally, other data sets collected figures for Male/Female Juvenile Drug Arrests - in Cities, in Suburbs, and in Rural Areas.
I was specifically interested in juvenile marijuana drug arrests in the United States but that data category was only collected and identified for some three years. This caused me to widen my scope, first to the category of juvenile drug arrests, and ultimately to the arrest of those less than 18 years of age for drug abuse offenses. Since there were over 17,700 agencies collecting criminal data by 2008, contacting them, and getting meaningful results, would have been impossible in the time frame I had. So I turned to the FBI’s Uniform Crime Reporting (UCR) Program. This program has been in effect since 1930 and it gathers crime statistics from the voluntary participation of the many law enforcement agencies across the nation. Although the data offers an incomplete picture of crime in the United States, the compilation has been annually published since 1958 in Crime in the United States (CIUS). This publication serves as the source of the governments’ (local, state, and federal) rationale for their policies.
In order to frame the statistical picture in visualization, I conceptualized a sculpture around three categories: Population, Arrests, and Location. Each of these categories, however, had substantially exclusive subsets aimed at defining juvenile drug arrest numbers. It is possible, however, that there was some bleed-through in several categories as well as some under or over reporting. Nevertheless, my interest was focused more on the nature of the change over time, rather than the absolute number, since a single case would make little overall difference in a pool of 100,000 instances.
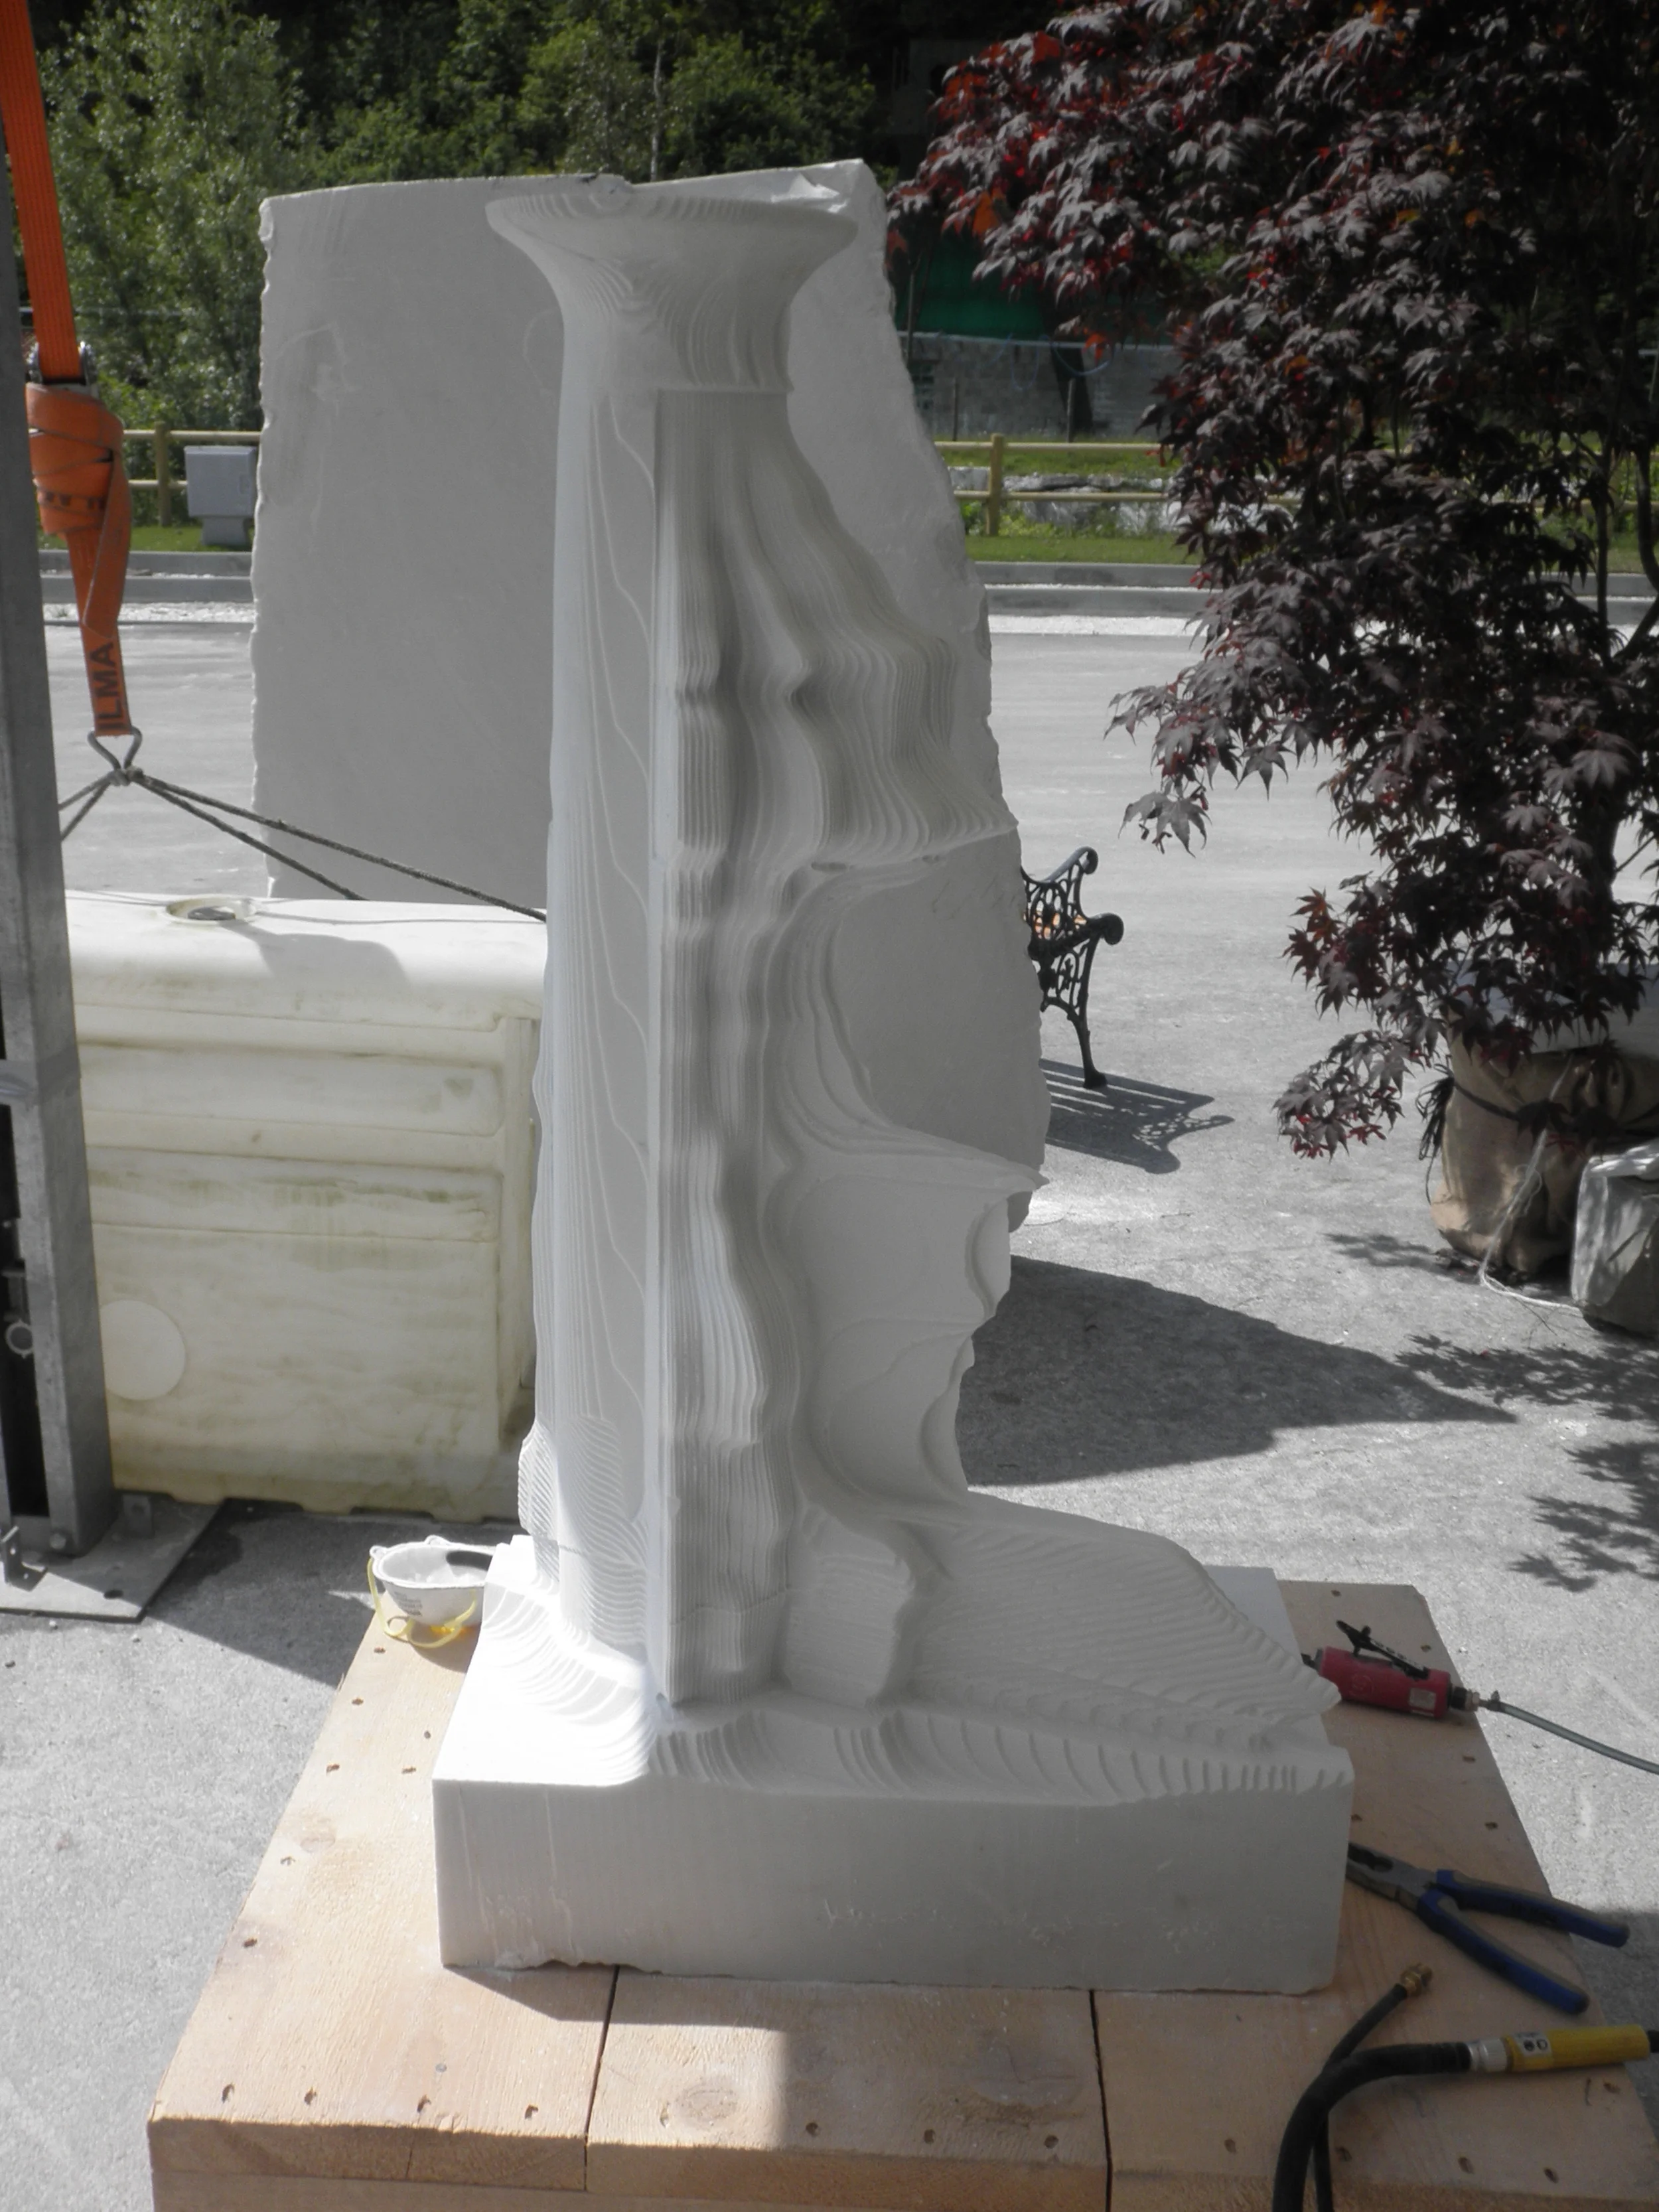
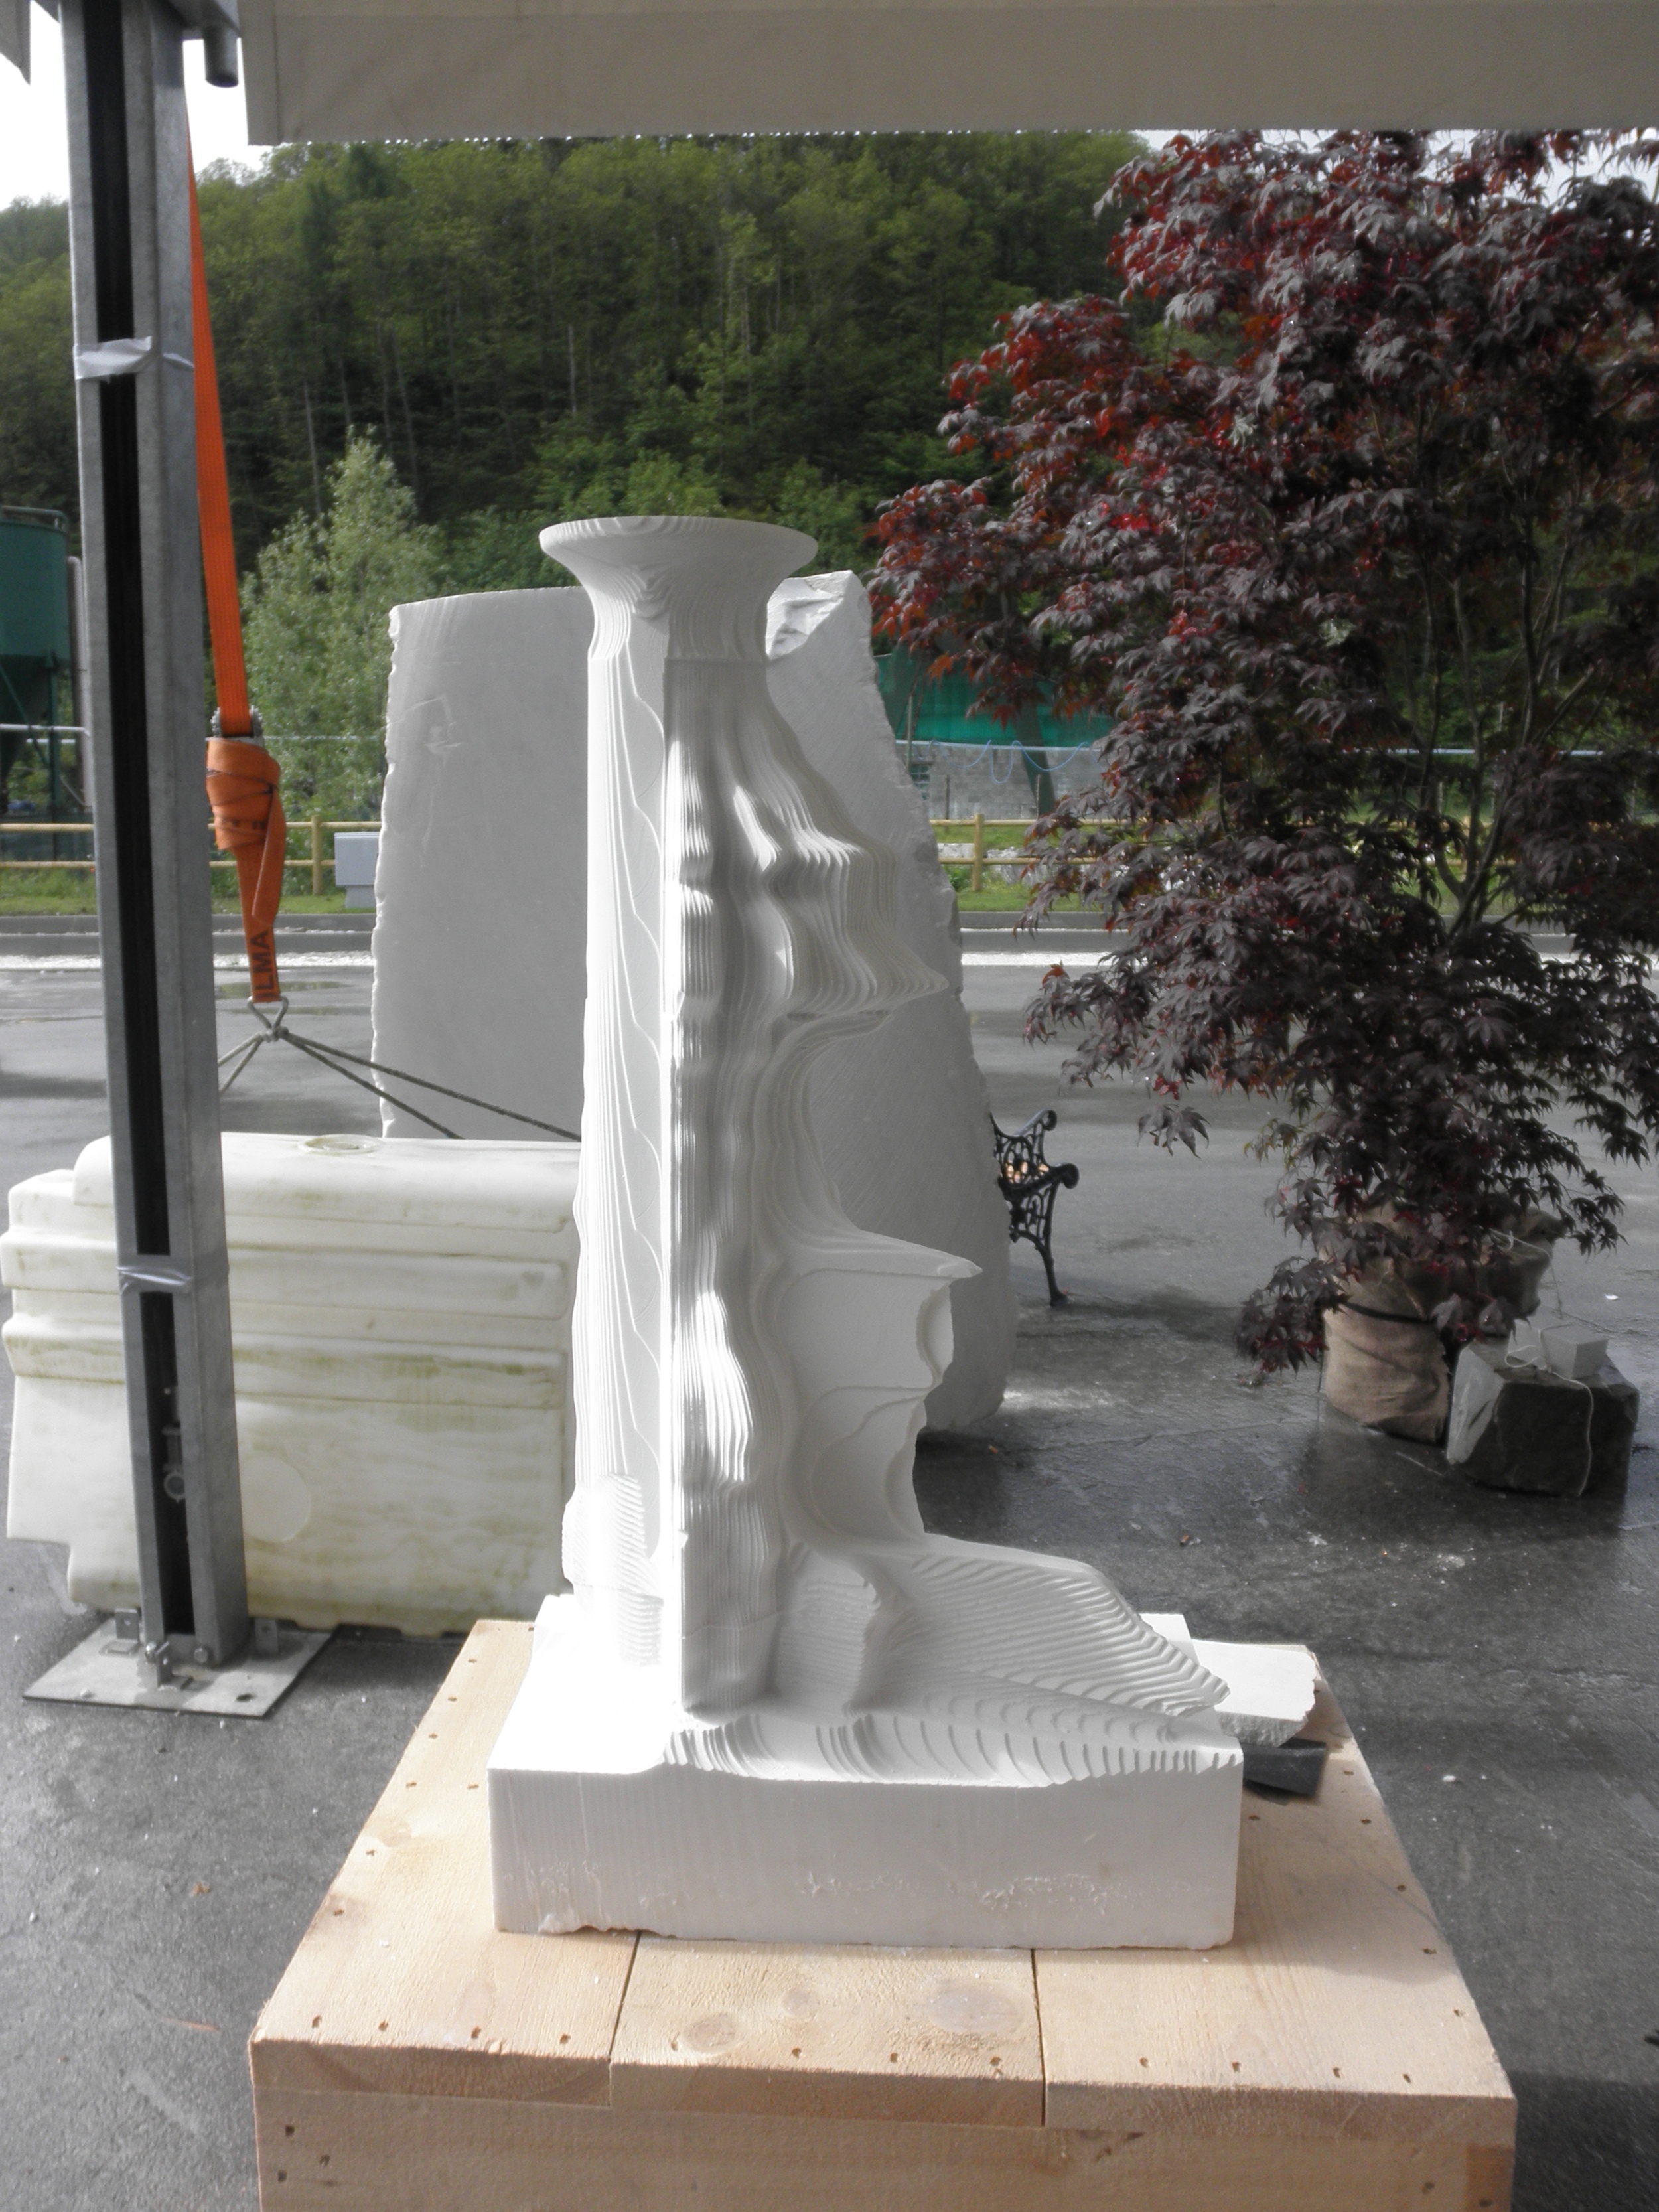
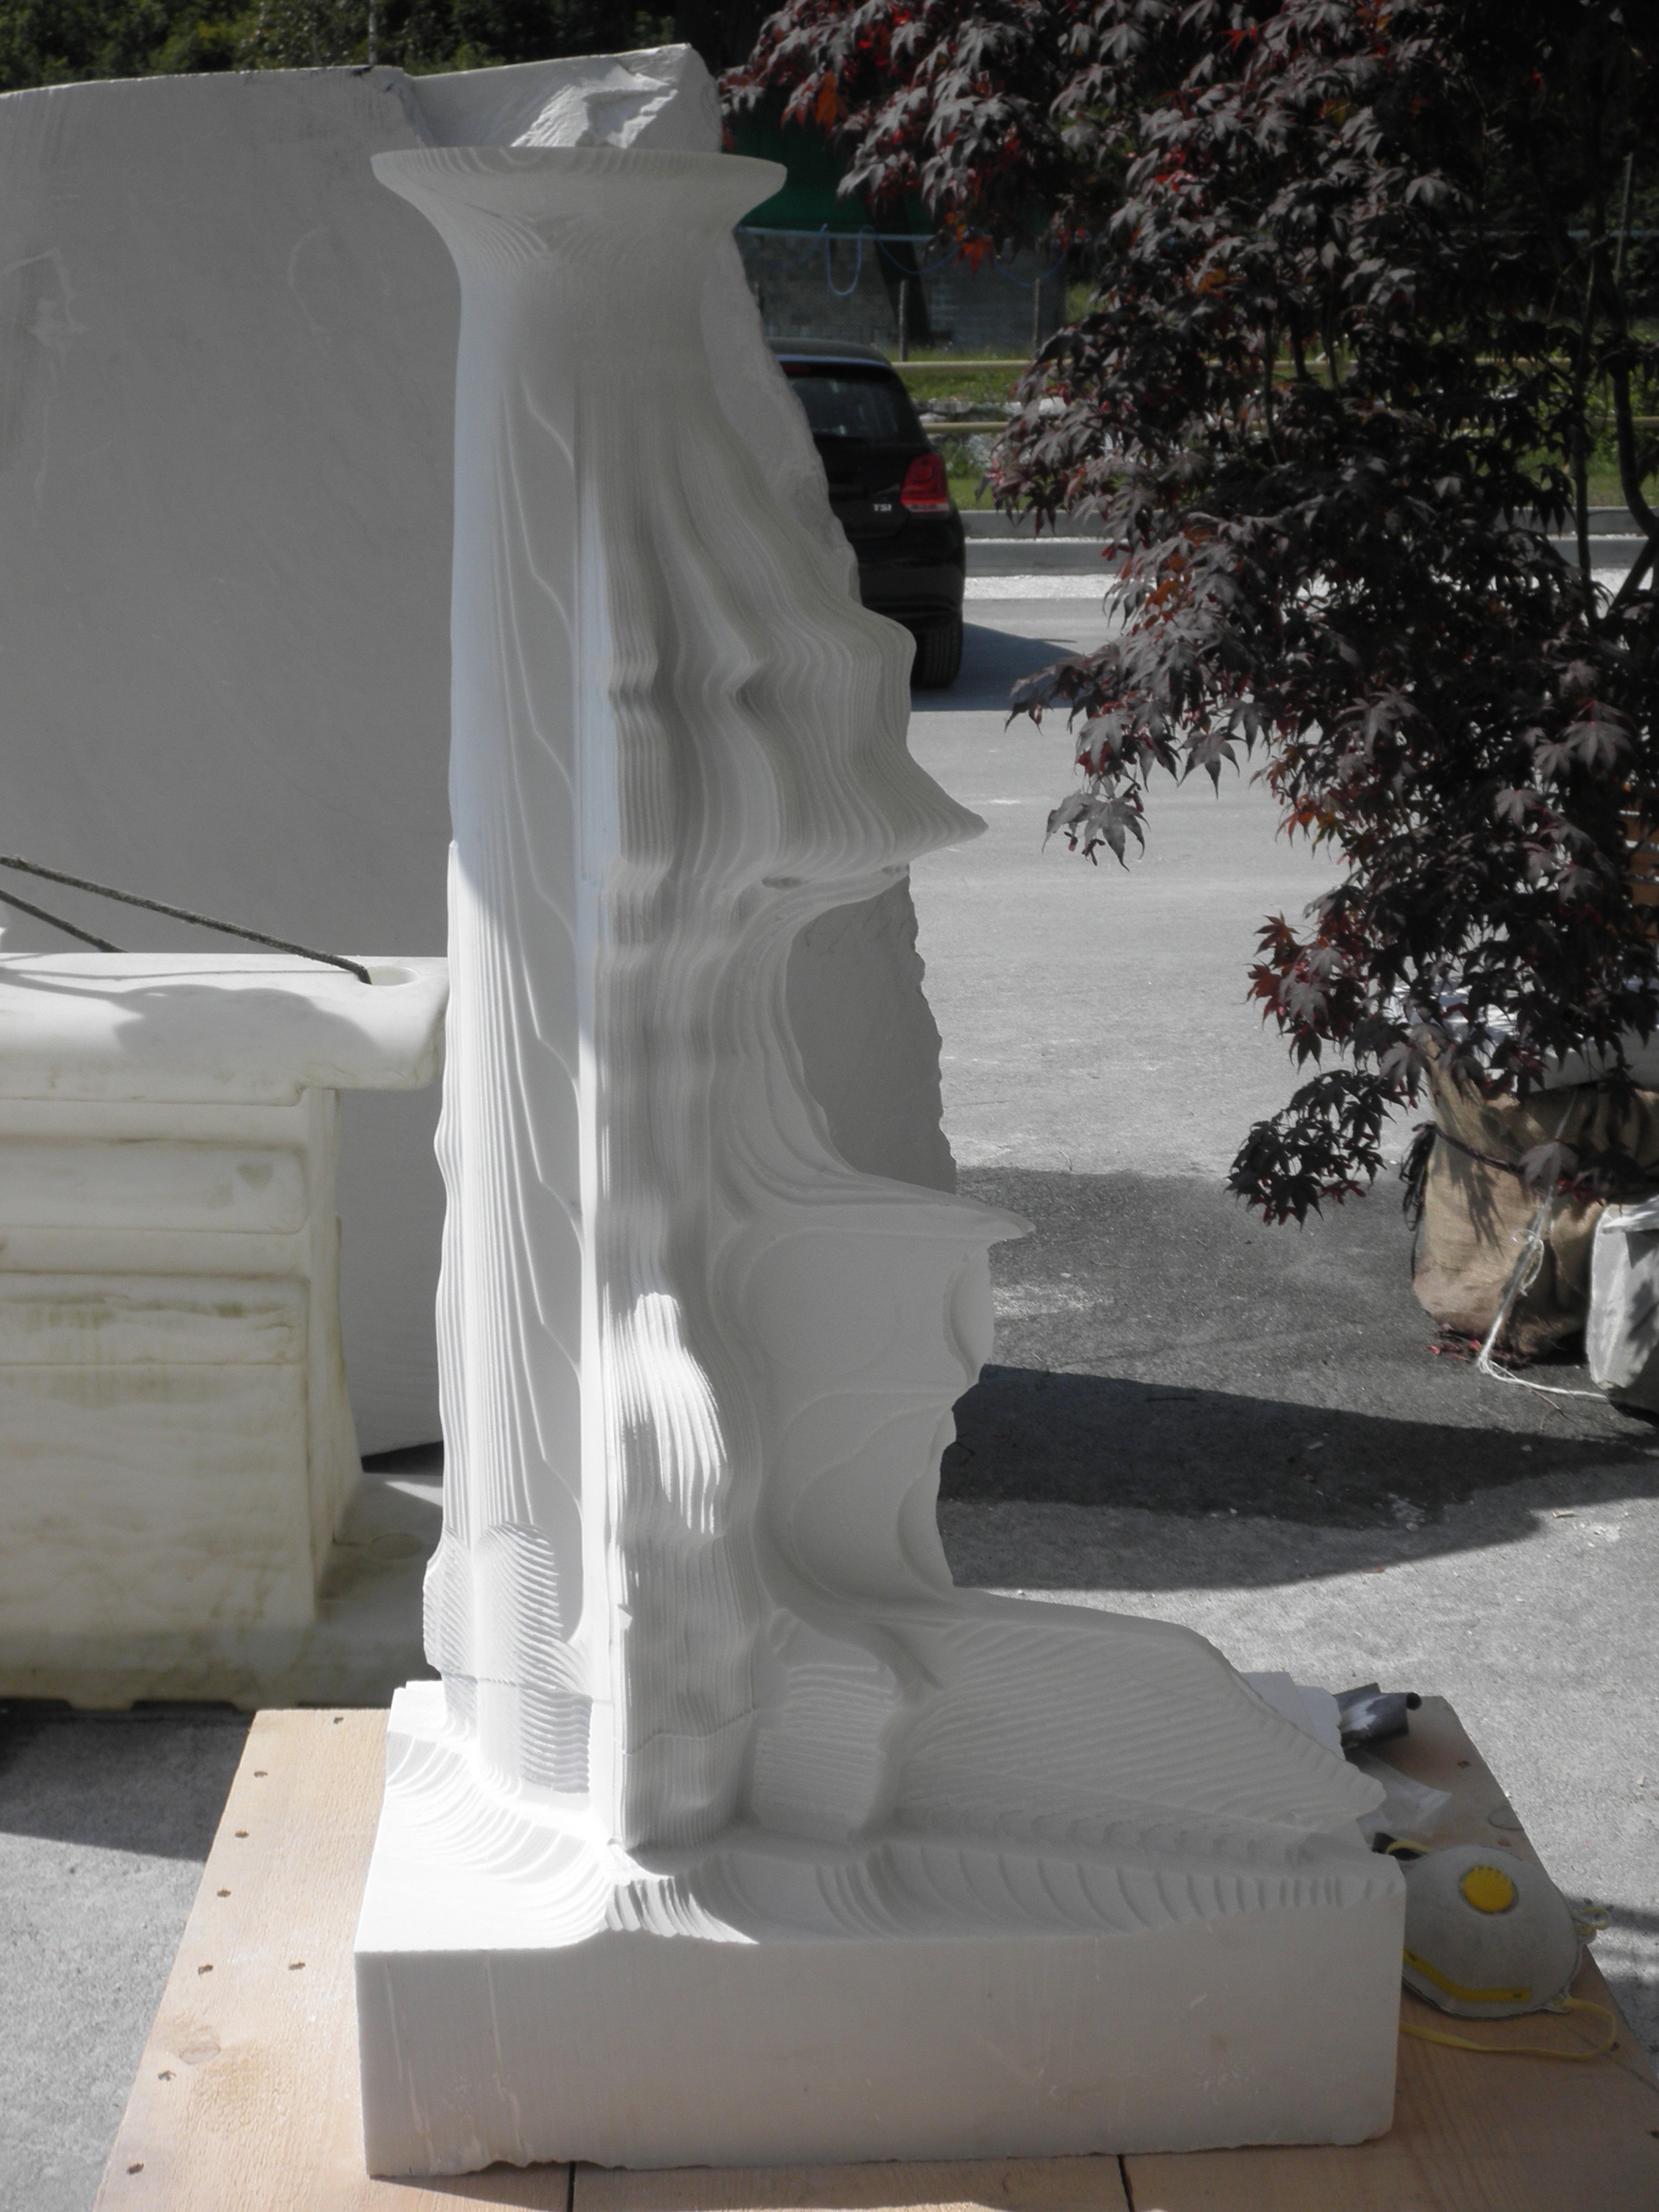
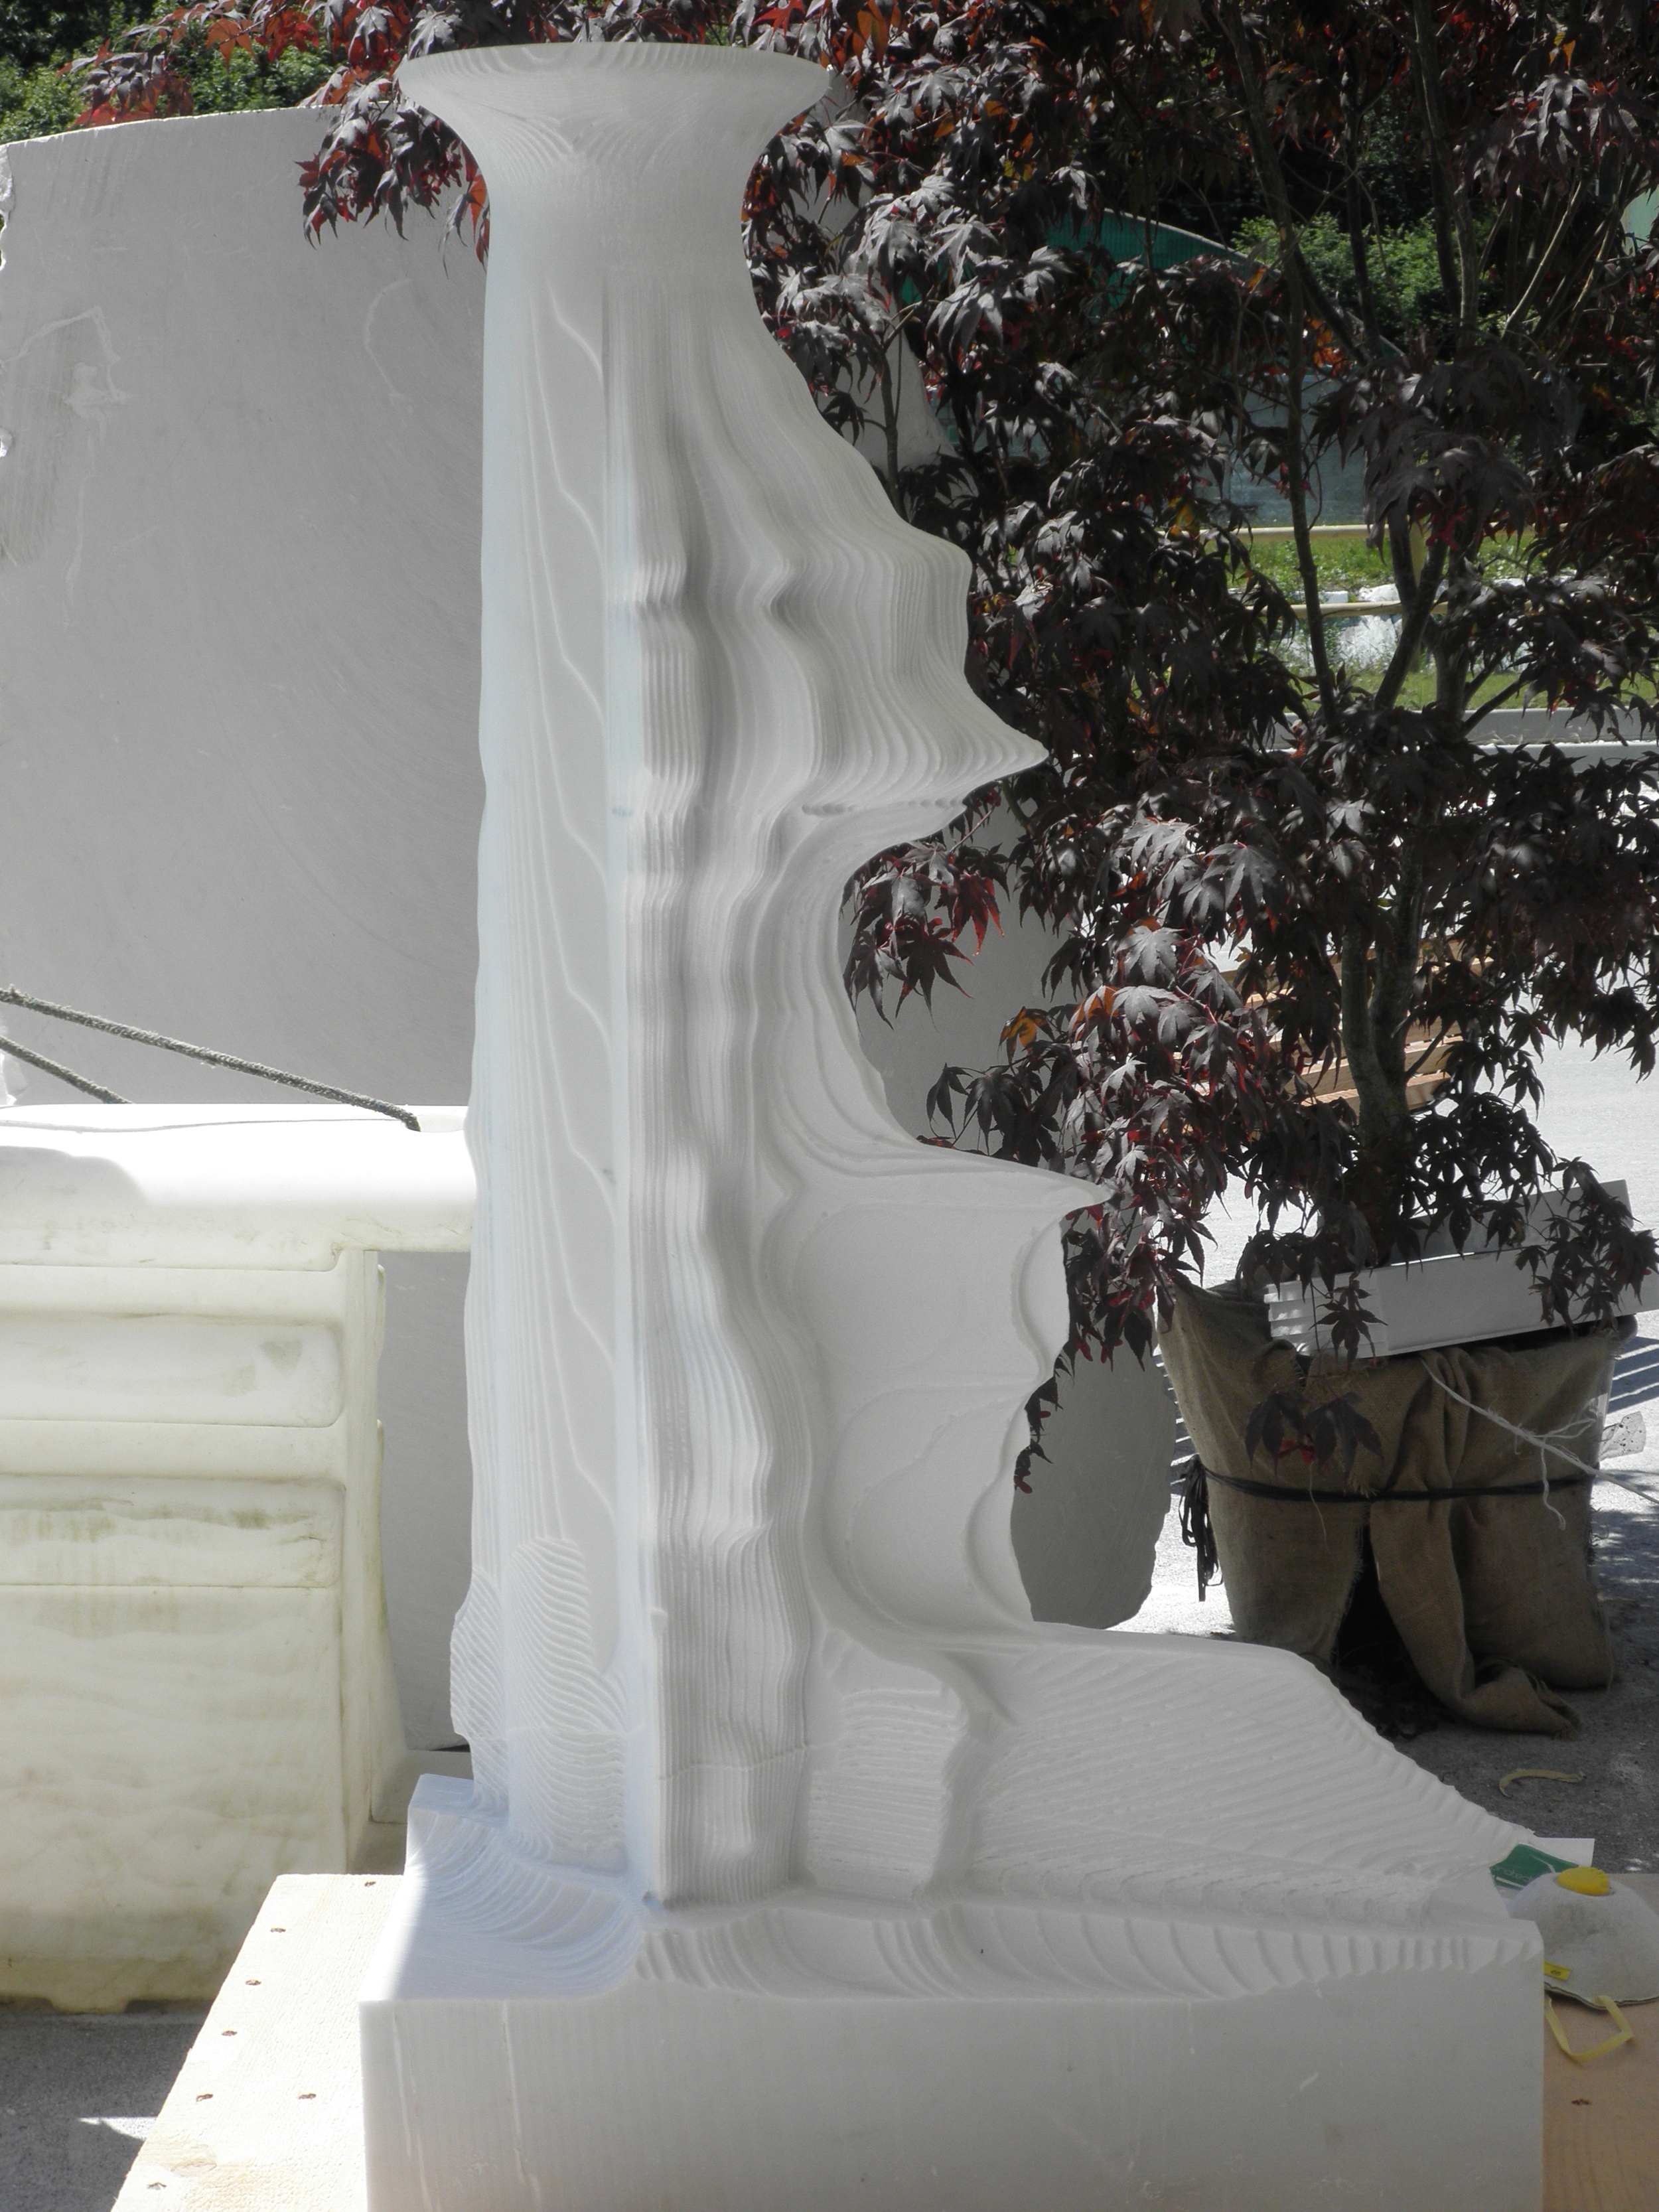
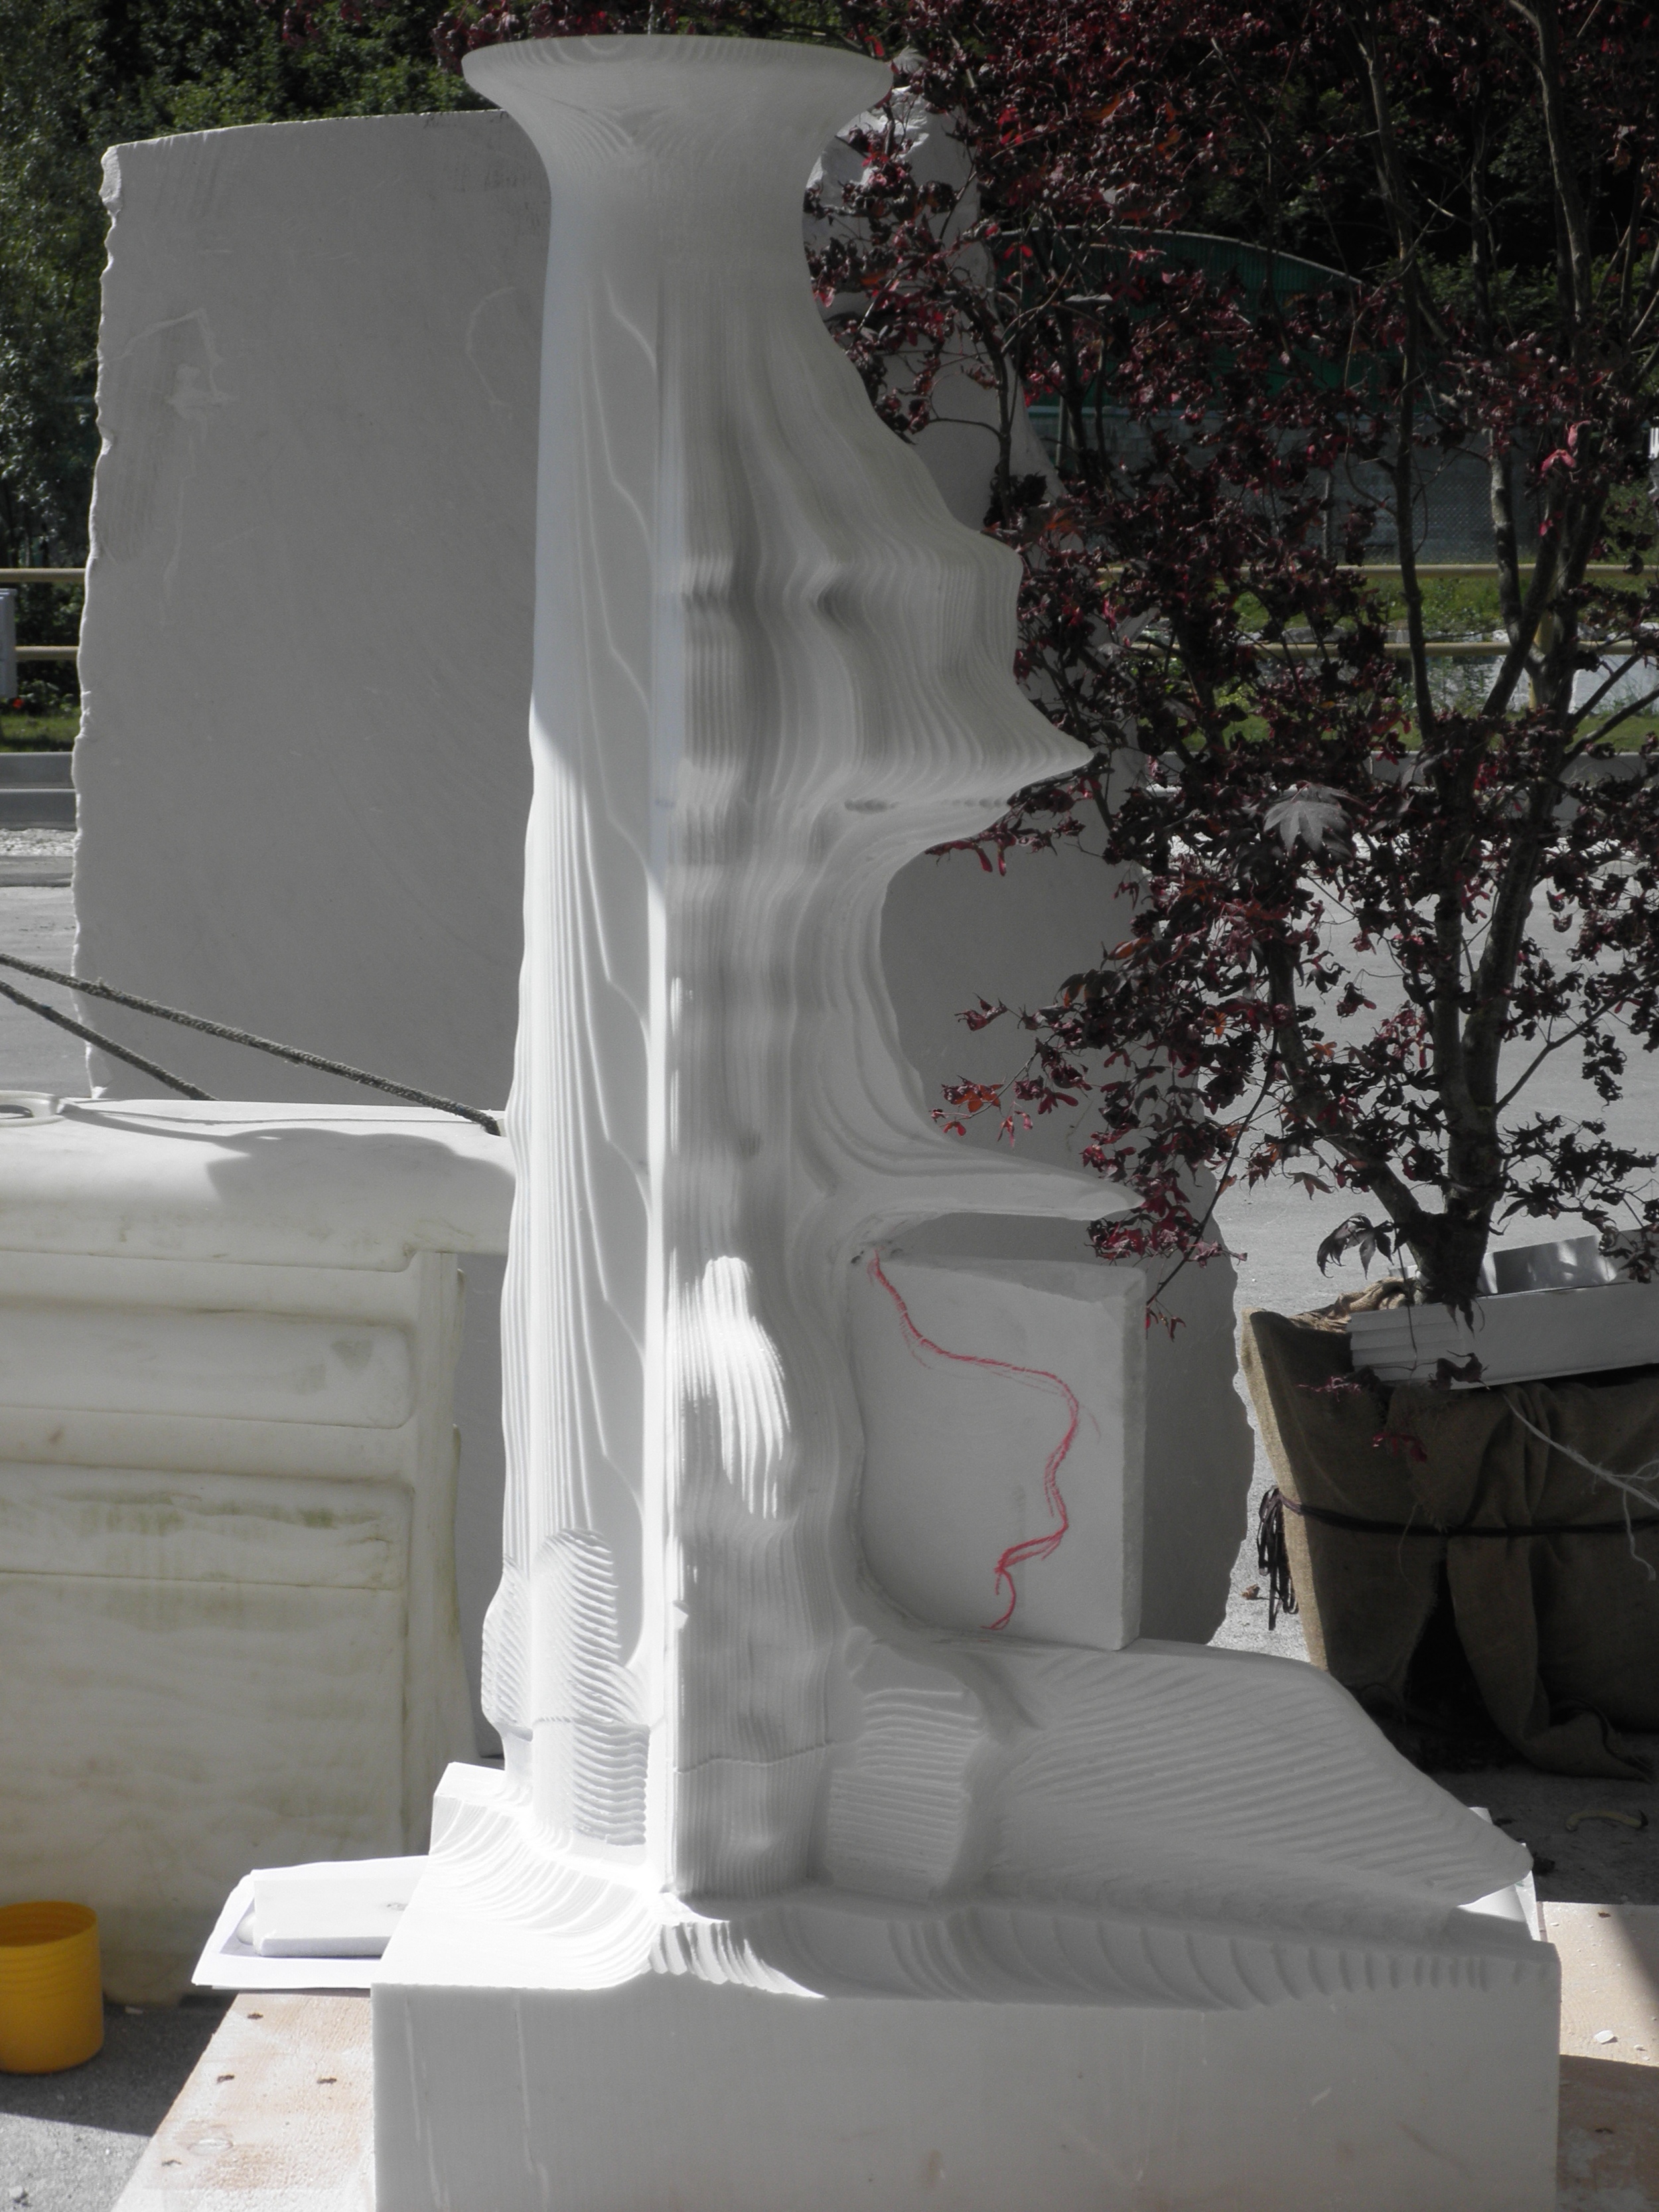
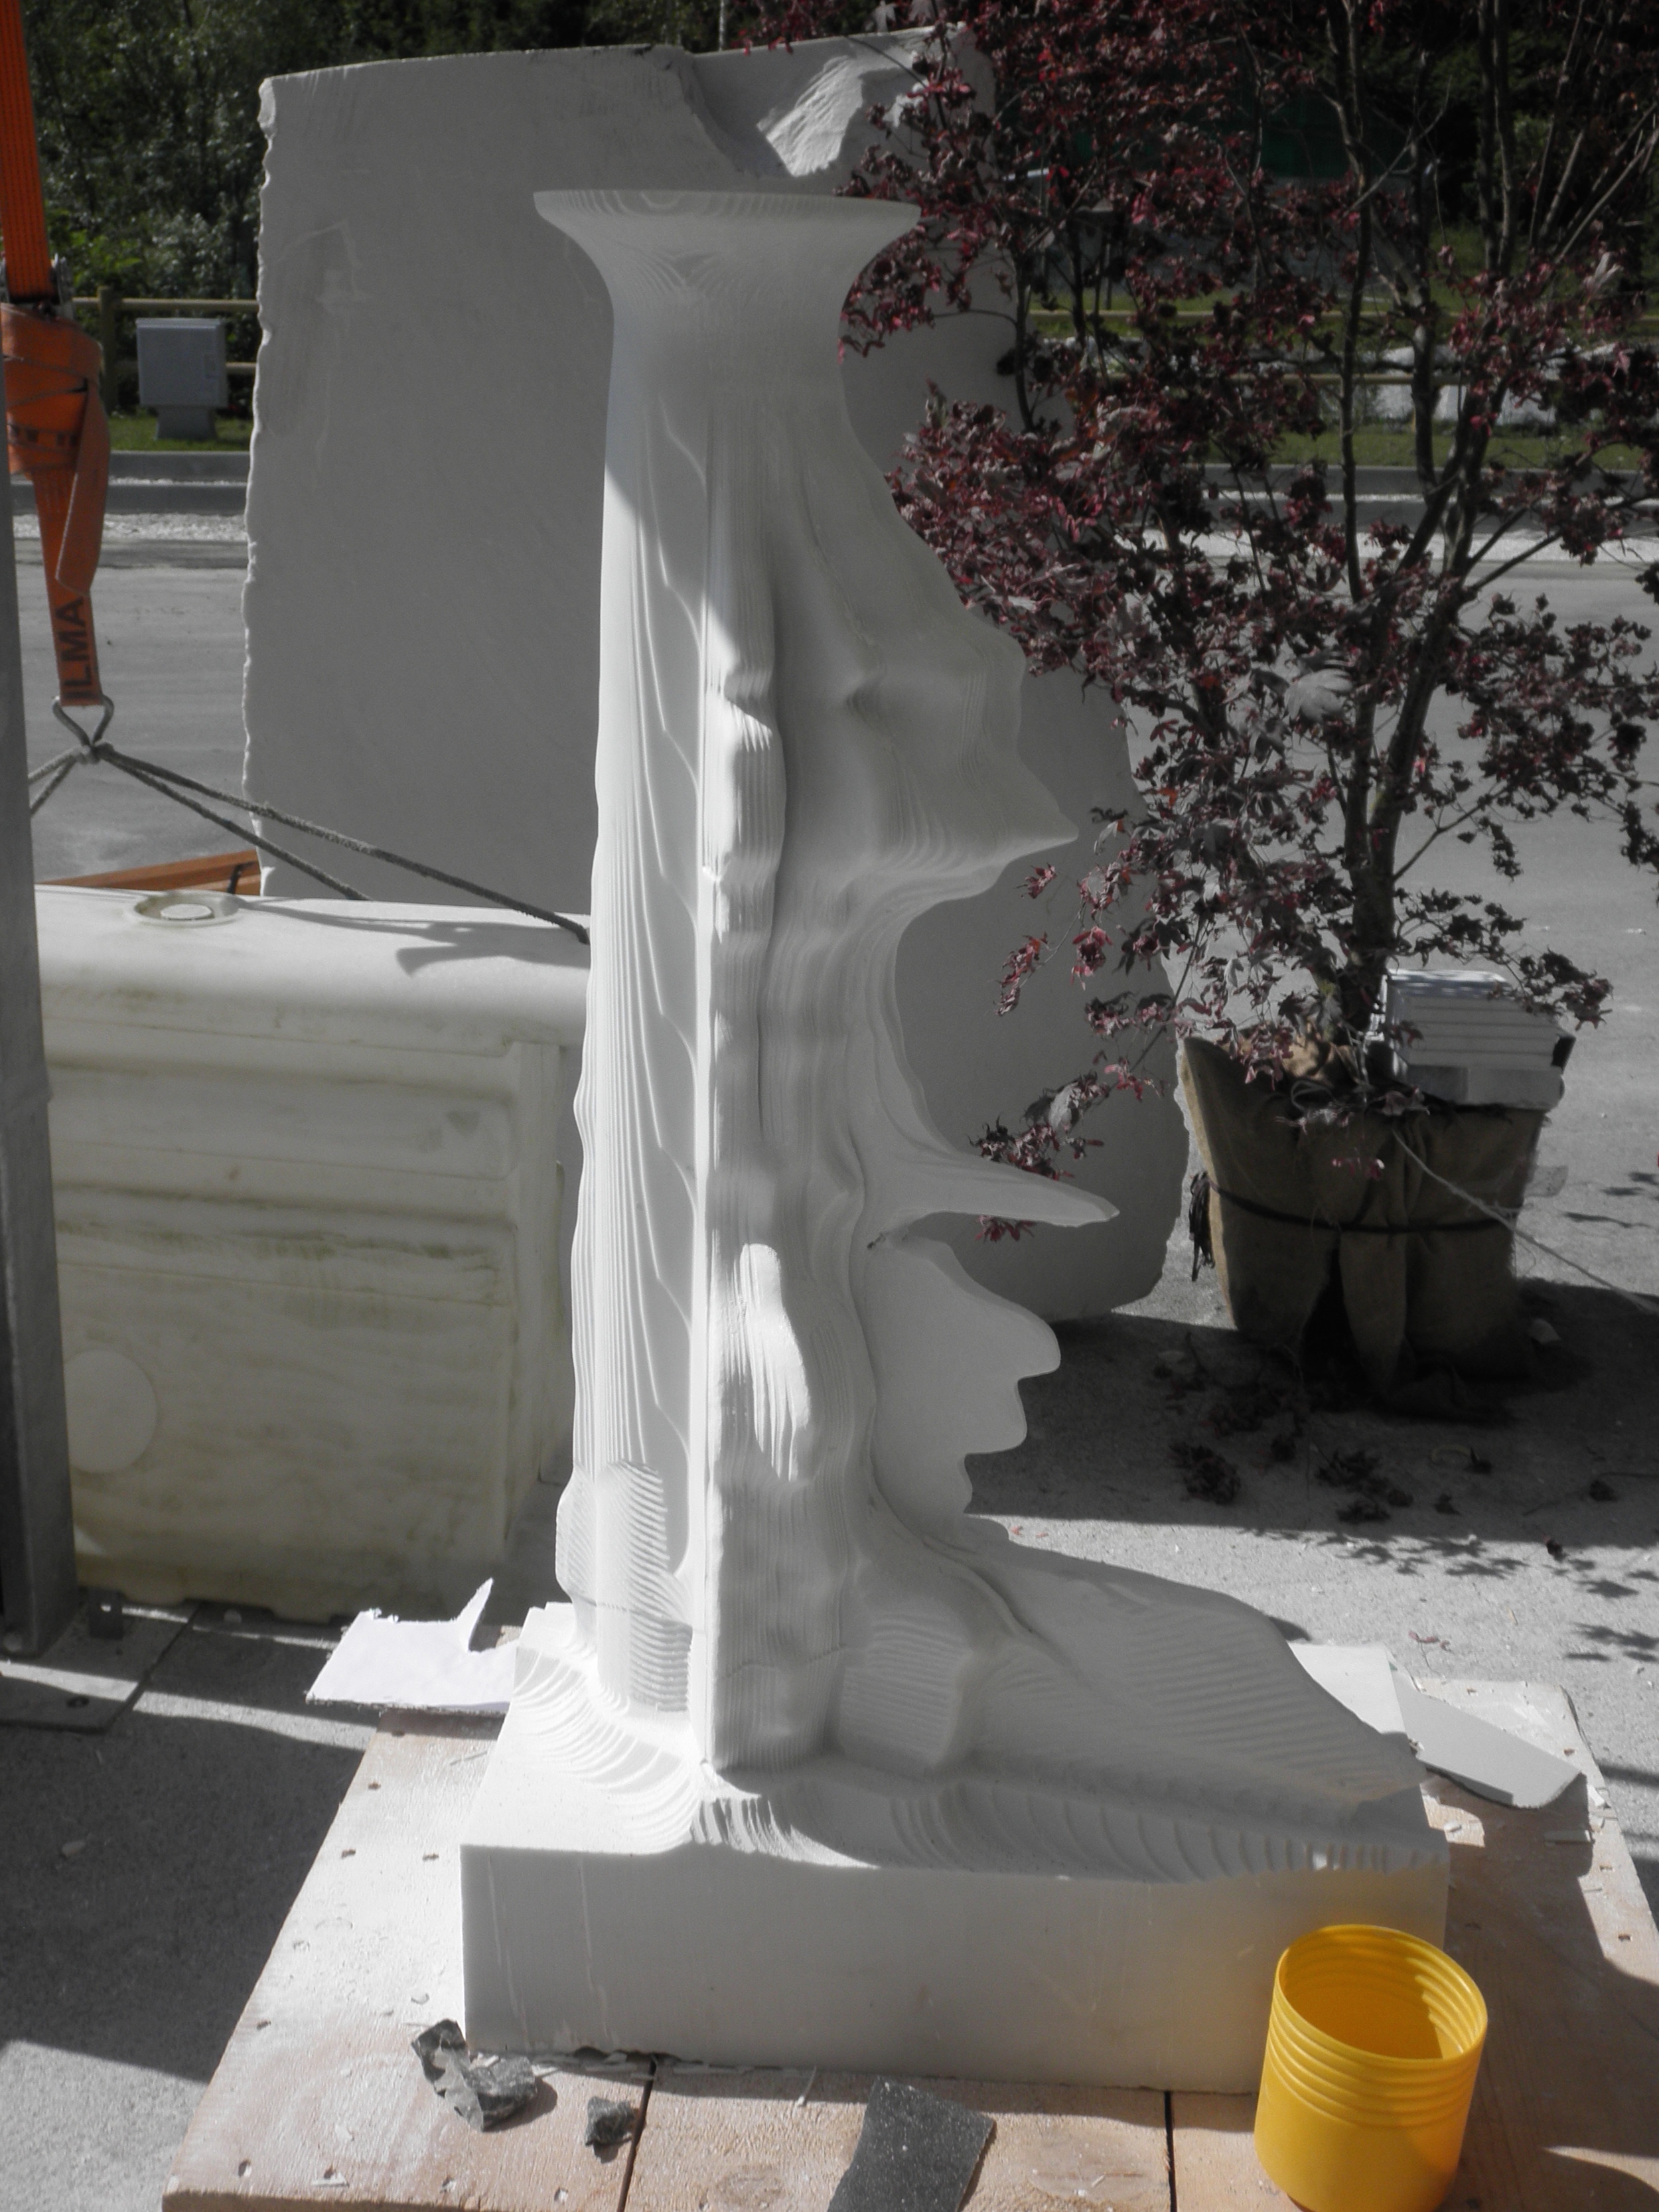
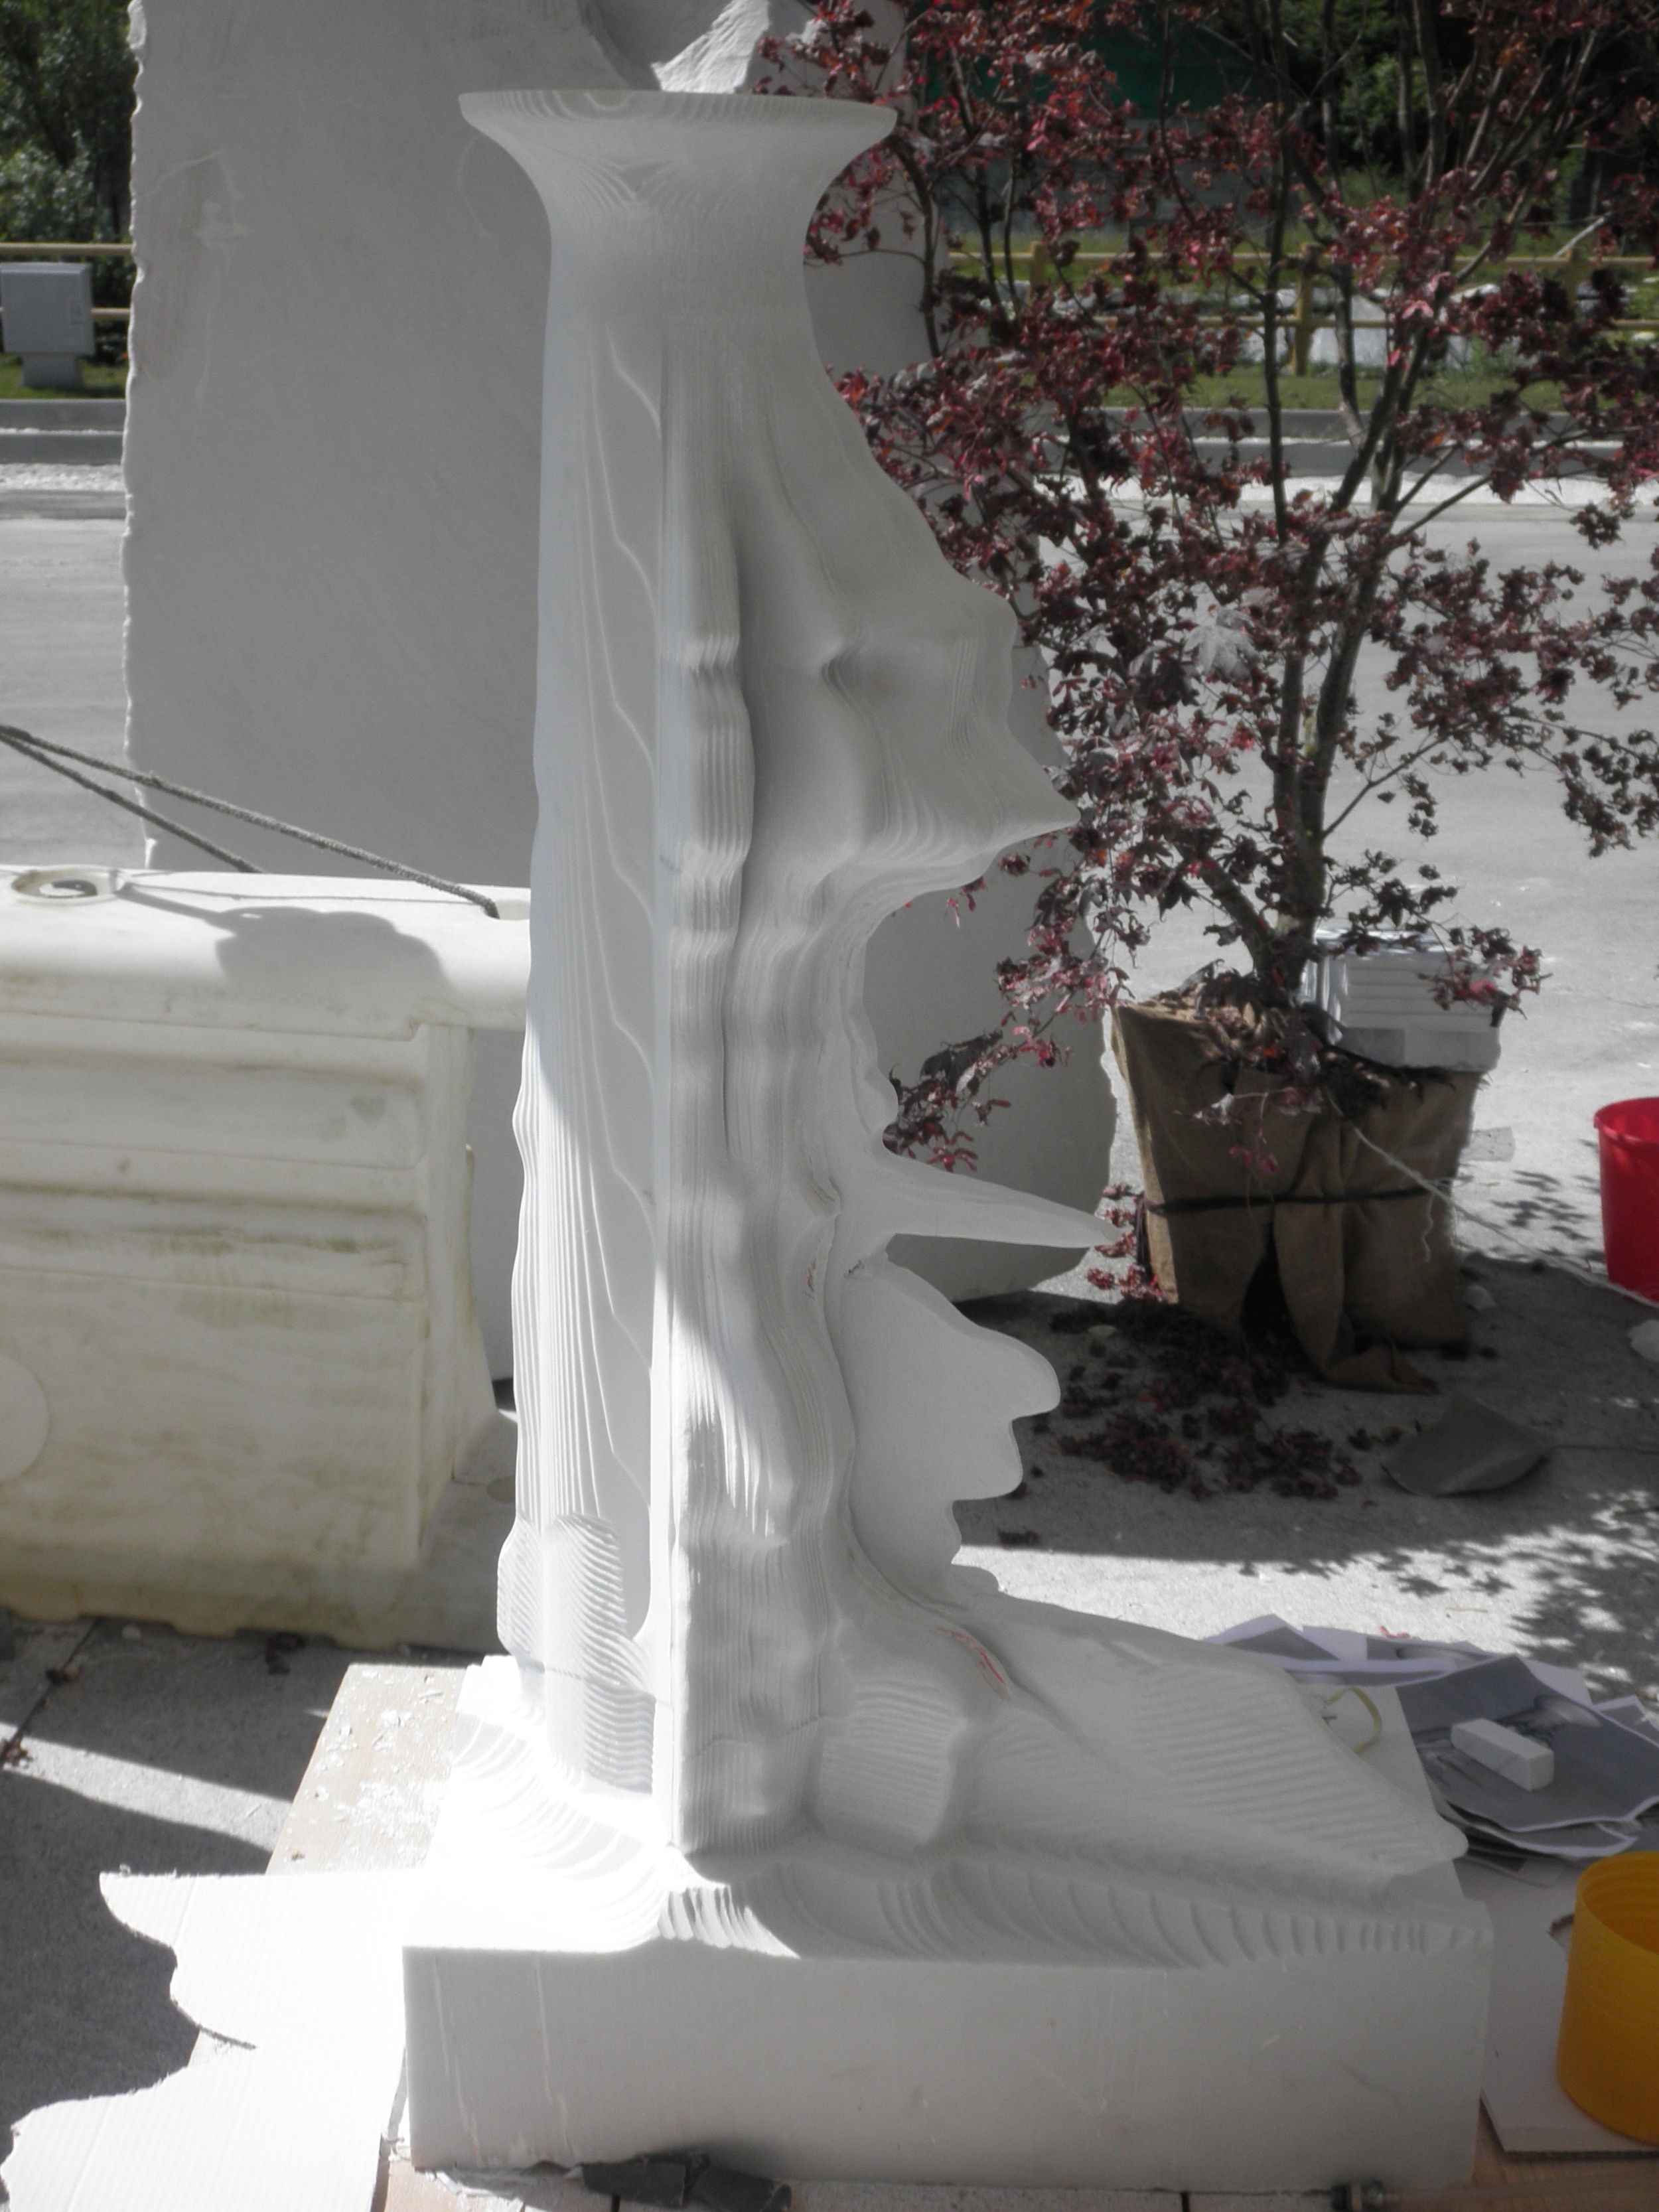
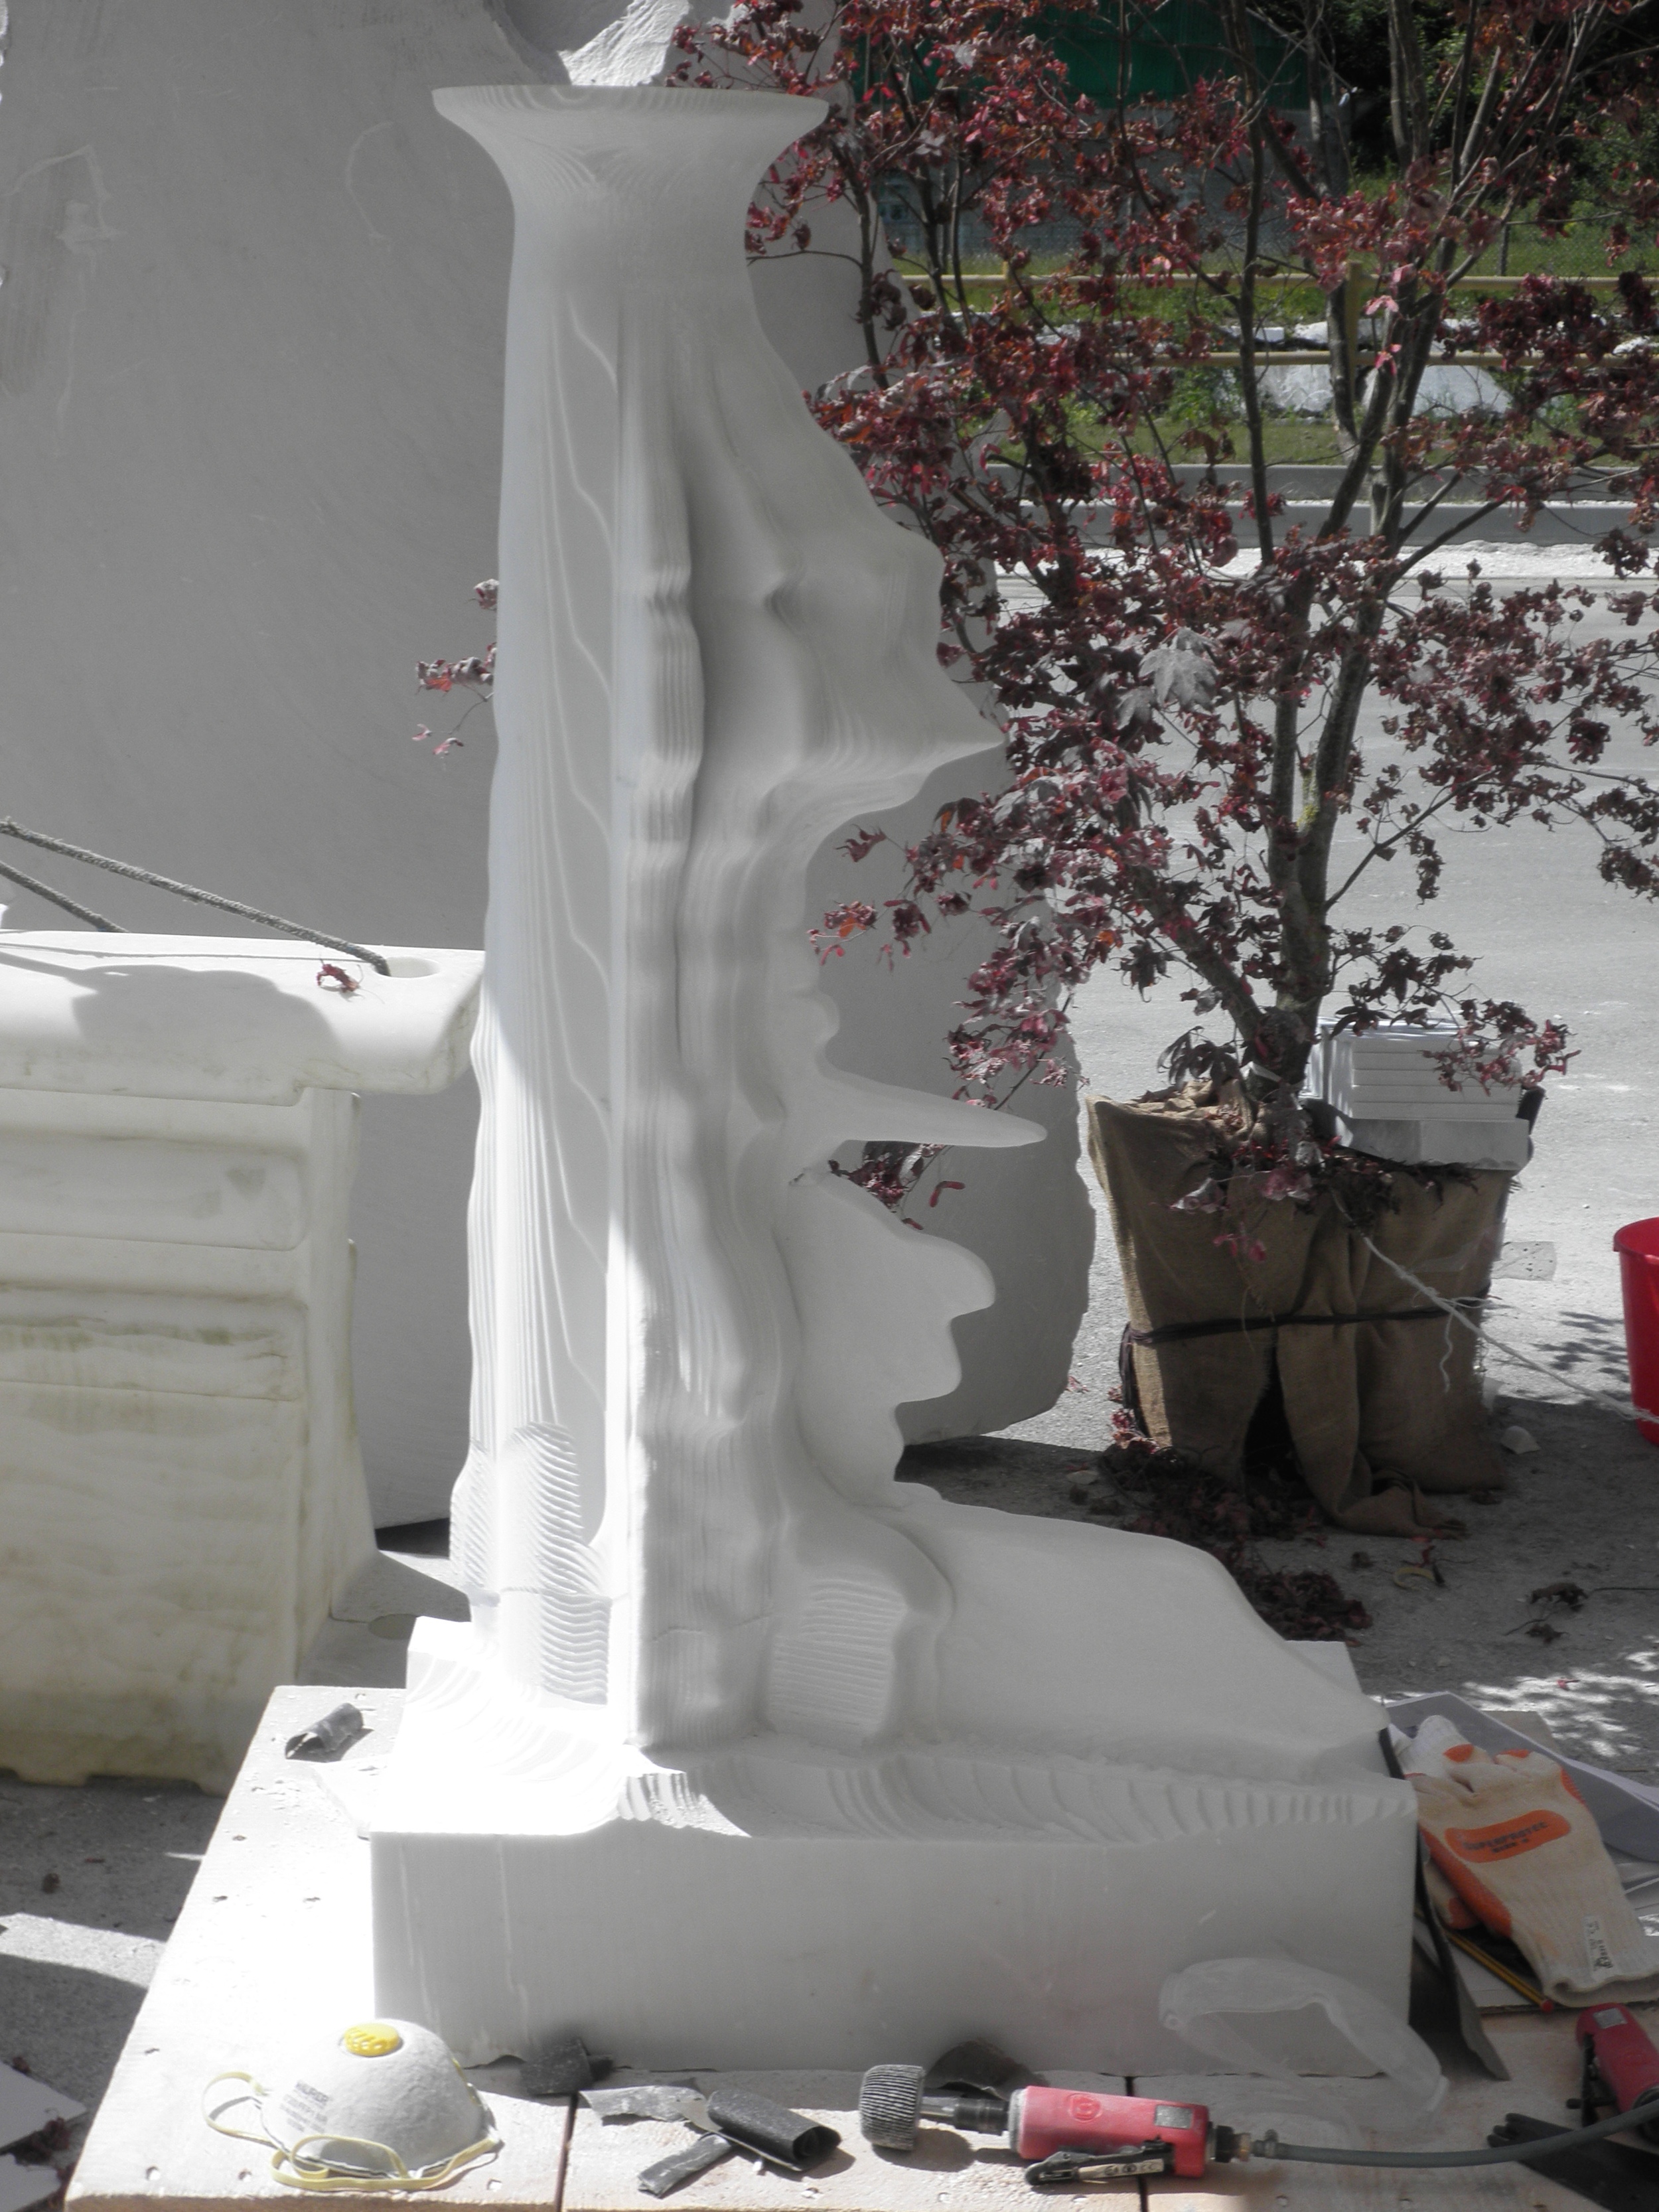
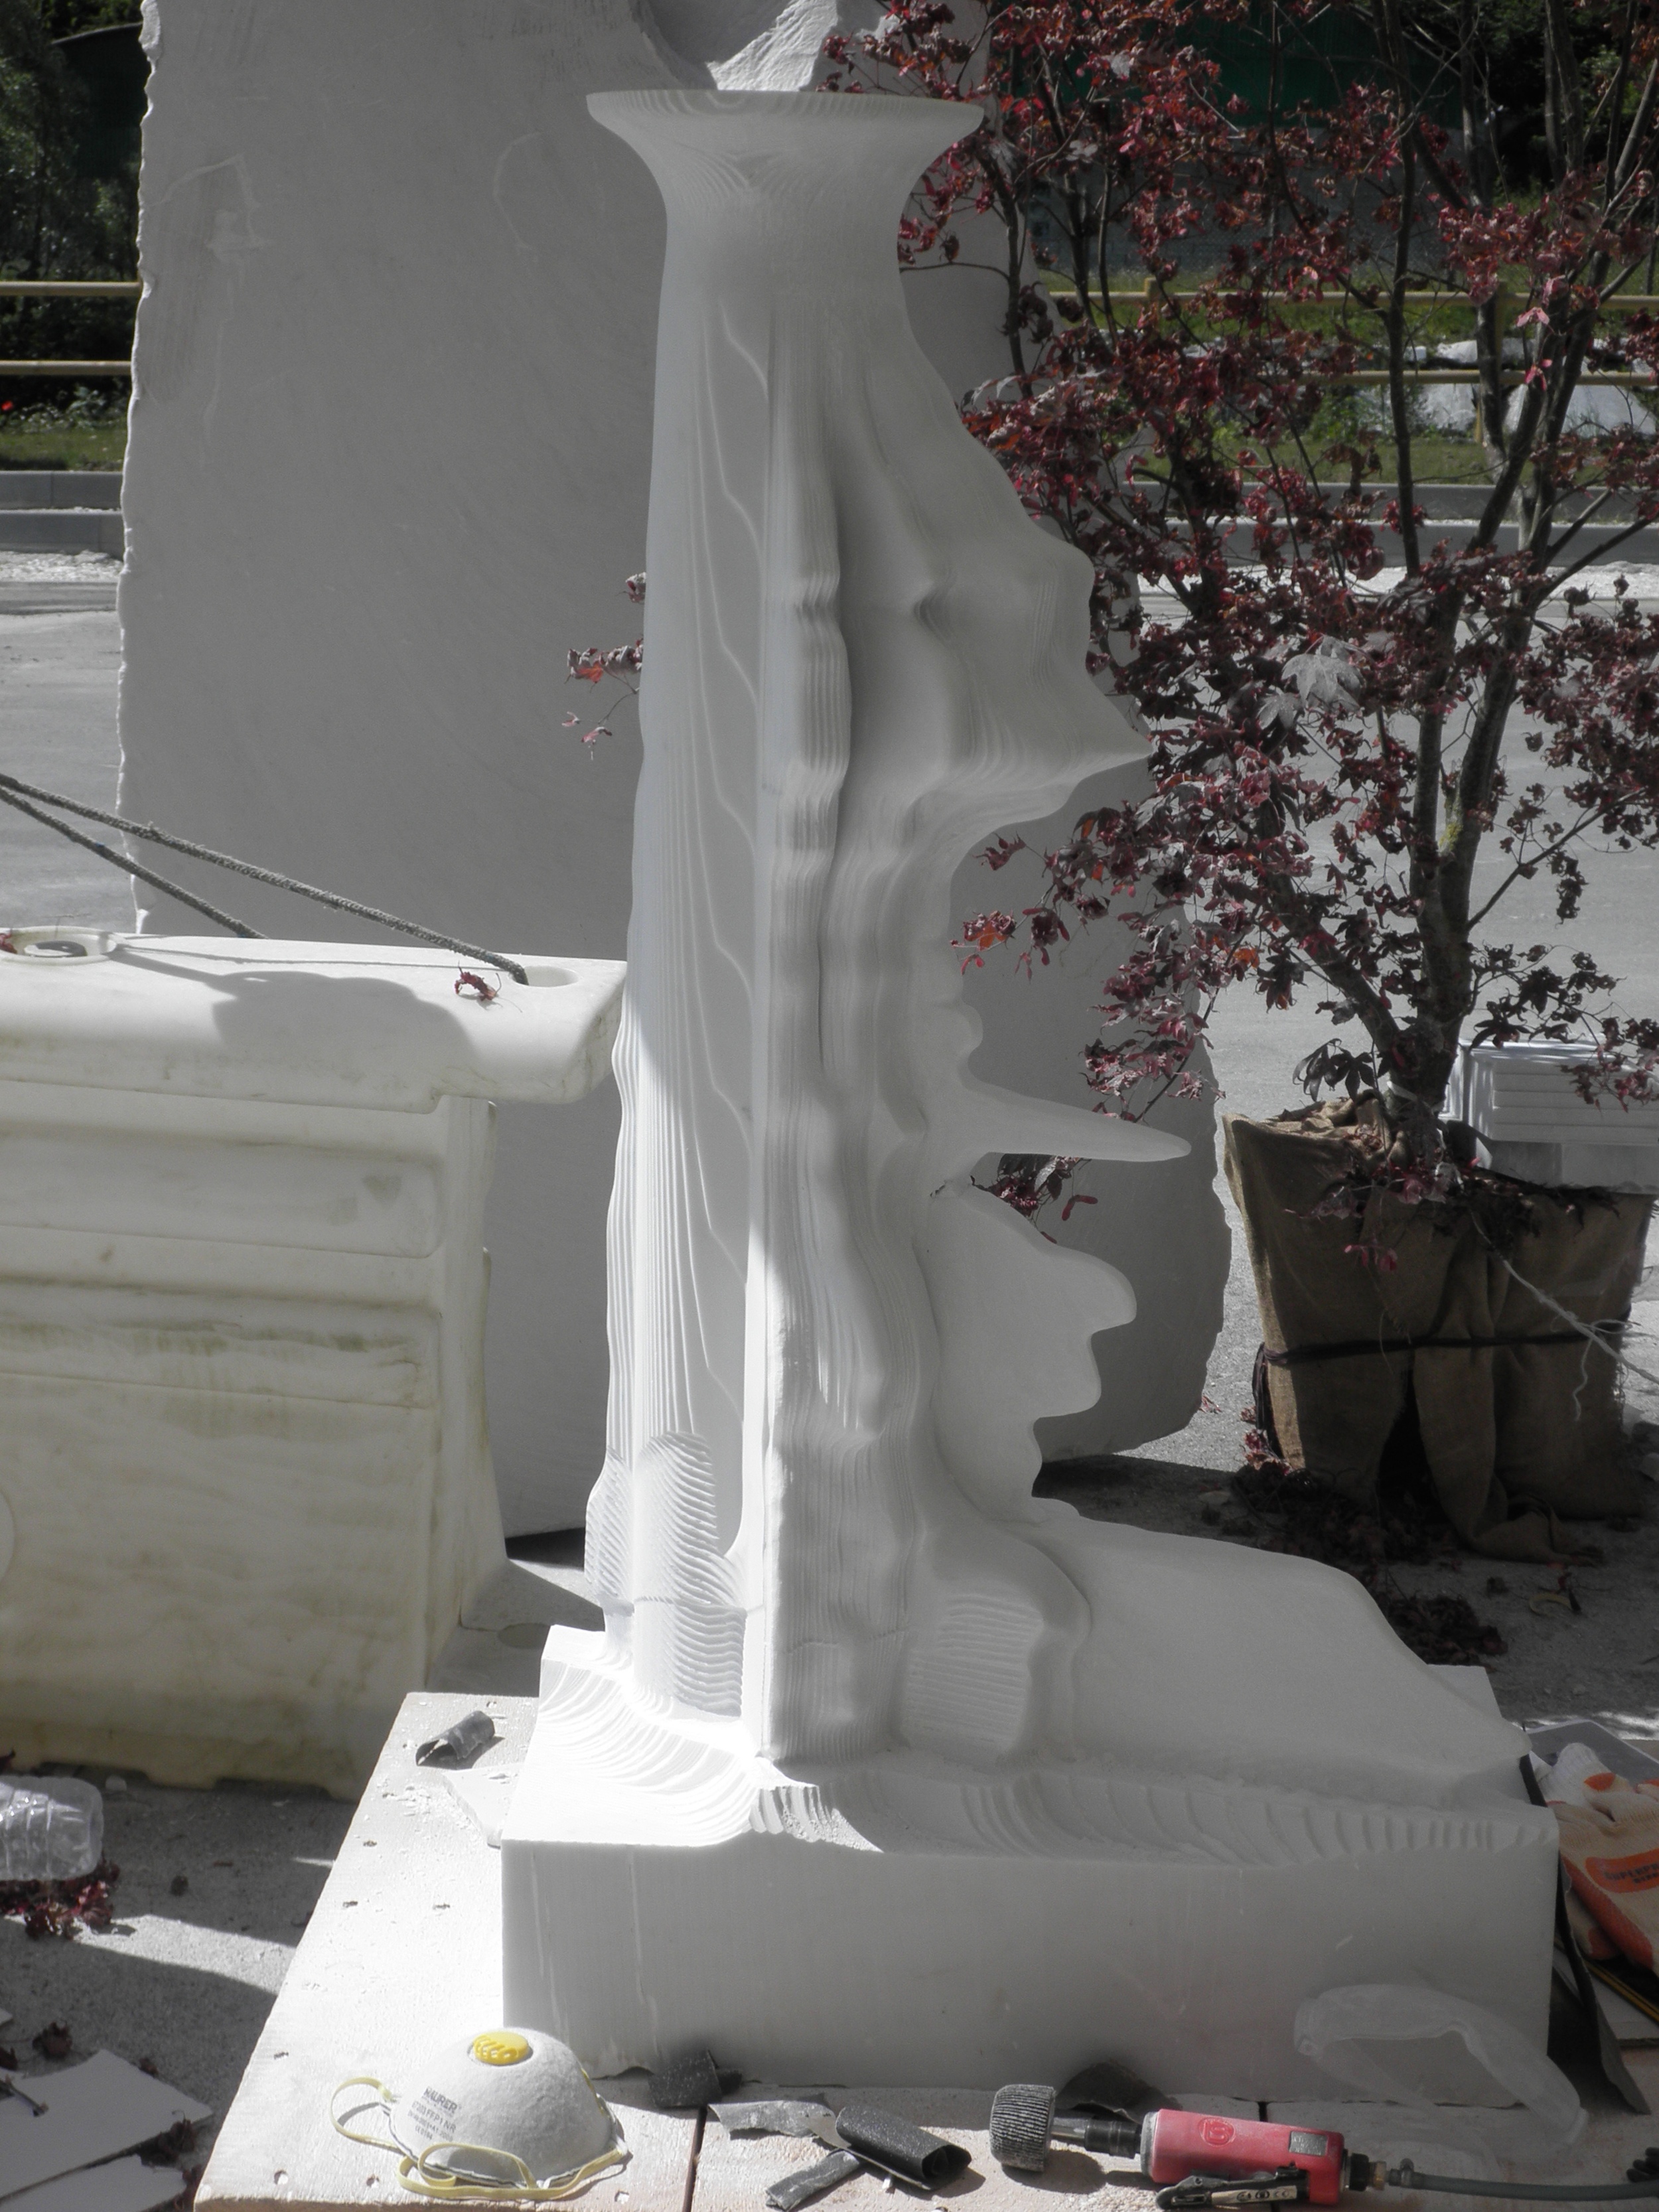
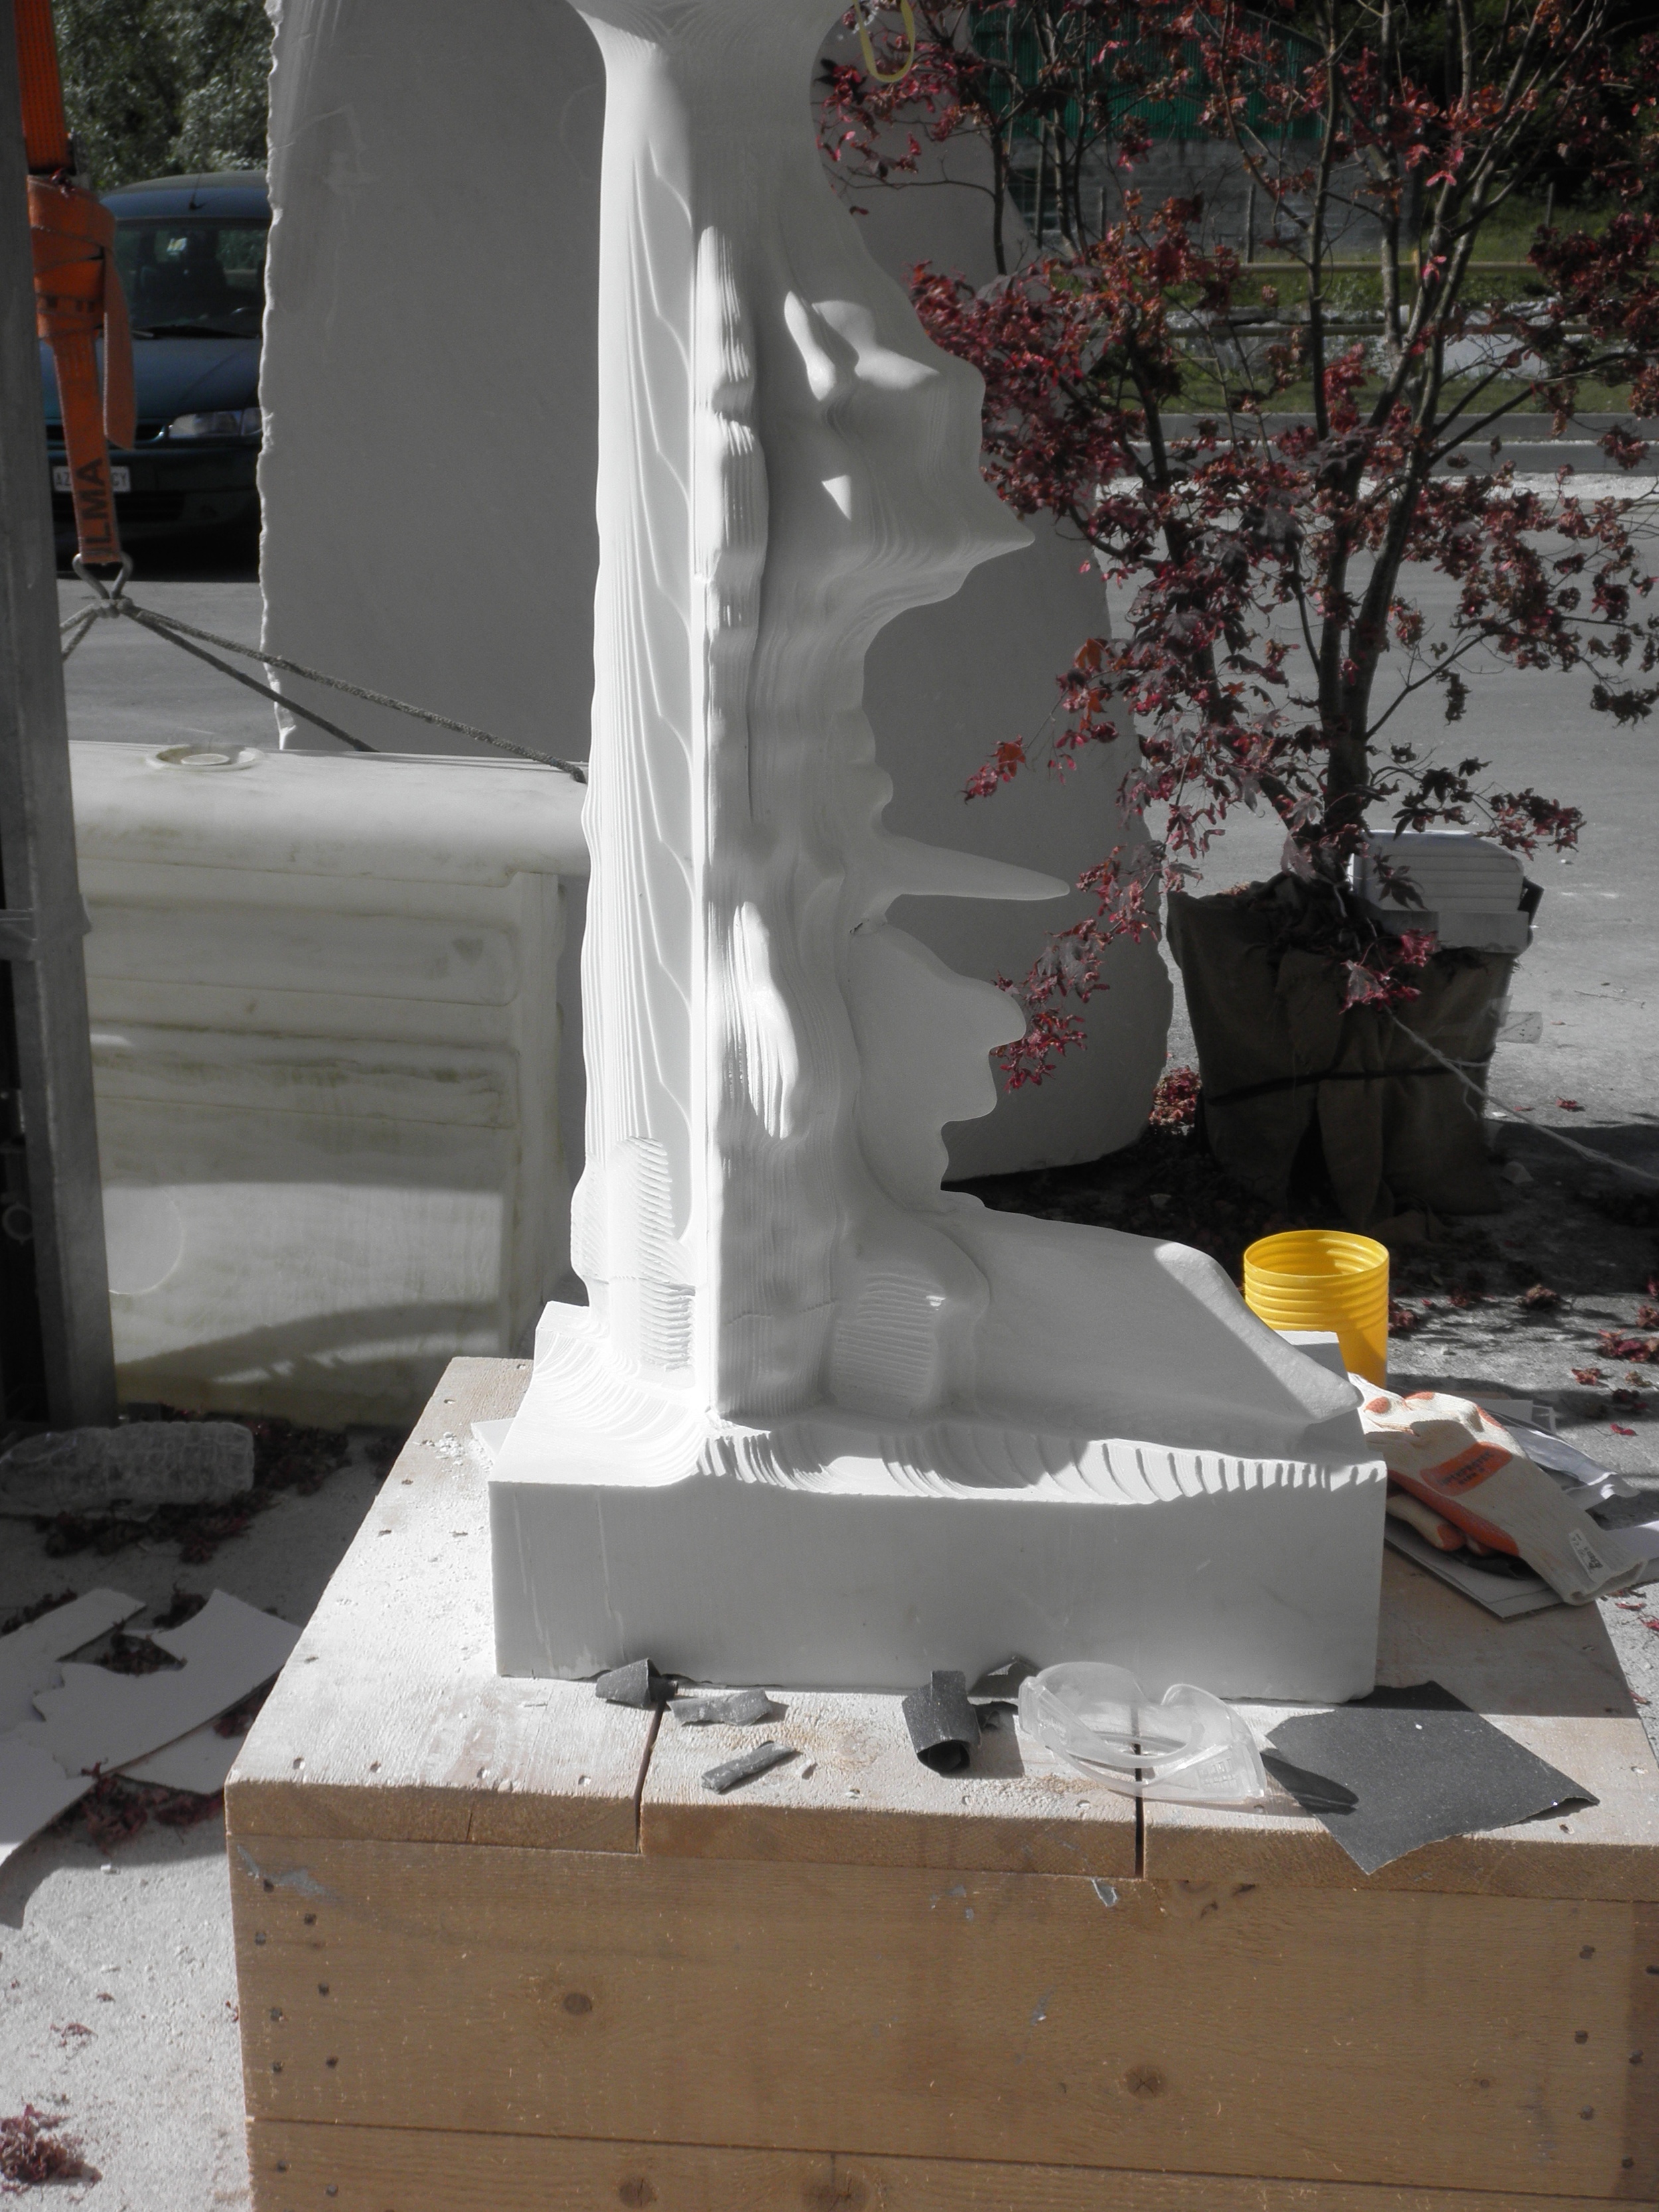

In total, I was able to identify 40 elements, either directly or by estimation, in every annual report for the 46 years (1964 through 2009). These 1,840 points were the core of the visualization of the nature of the state of juvenile drug arrests in the United States during that period. Using the software Rhinoceros 3-D and its plug Grasshopper, the data generated the visualization that created the final sculpture.
I began by looking at the population of the United States in 1964. Of an estimate of 191,888,791 less than 21 million were black, about 10.77%. That year the total number of juveniles arrested was 961,132. Within that pool, the number of racially identified juvenile drug arrests was only 2,418 or 0.25%. In that number there were 593 individuals identified as black and 1,789 individuals identified as white juveniles, a 24.5% - 74% split.
By 2009 the population of the United States had increased to an estimated 307,007,000 with a black population subset of almost 39.6 million. Thus, while the total population had increased by almost 60%, the black population increased almost 92%. During this time frame the total number of juvenile arrests increased to 1,515,586 or almost 57.6%, which was in line with the total population increase. However, the significant increases occurred in both the number of racially identified juvenile drug arrests and in the number of black juveniles arrested for drug abuse. In 1964 there were only 2,418 minors arrested for drug offenses. By 2009 that number was 134,207 an increase of almost 4,073% or almost seventy times the increase of the population. The number of identified back juveniles arrested for drug use in 2009 was 34,295 more than a 5,783% increase over forty-six years. This was happening at a time when the black population represented slightly more than 12.9% of the total population. Black juvenile arrests for drug abuse represented almost 25.5% of those arrested for drug offences, a slight increase over their percentage in 1969. More significant was the fact that in 2009 there were only 97,232 white juveniles arrested for drug abuse. Put another way there was one black juvenile arrested for drug abuse for every 2.84 white juveniles at a time when the population had a ratio of one black for every 6.16 white resident. This disparity is not a one-off. Rather it represents a pattern in which greater extremes occur but in which a steady disparity and injustice is always present.
For example if we look at the figures for 1991, the number of black juveniles arrested for drug use was 29,172 or 50.07%, while the number of white juveniles arrested for drug use was 28,428 or 48.8%. This was in spite of the fact that black juveniles represented a little over 12.5% of the age cohort.
In the period 1987 through 1999, black juveniles arrested for drug use represented an average of 38.1% or over three times their population share. No matter how we slice the data, the injustice was compounded by the magnitude of the number of juveniles arrested for drug offences and the disproportionate number of racial arrests for the same offences.